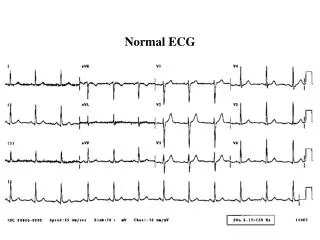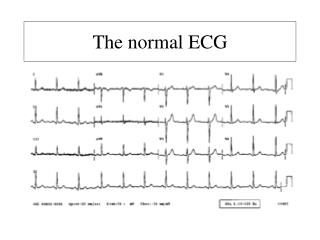
Normal ECG
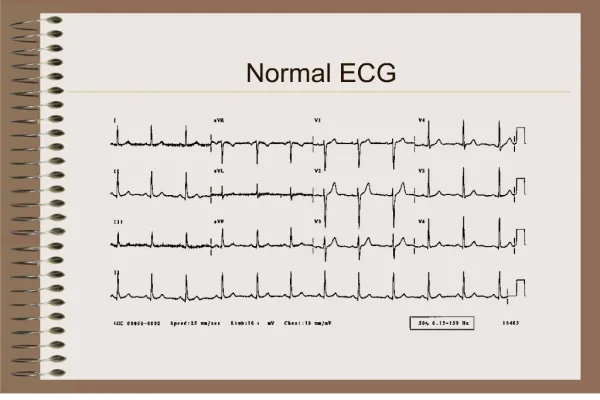
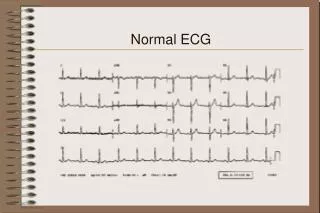
Normal ECG. normal sinus rhythm each P wave is followed by a QRS P waves normal for the subject P wave rate 60 - 100 bpm with <10% variation rate <60 = sinus bradycardia rate >100 = sinus tachycardia variation >10% = sinus arrhythmia normal QRS axis normal P waves

Normal ECG
E N D
Presentation Transcript
normal sinus rhythm • each P wave is followed by a QRS • P waves normal for the subject • P wave rate 60 - 100 bpm with <10% variation • rate <60 = sinus bradycardia • rate >100 = sinus tachycardia • variation >10% = sinus arrhythmia • normal QRS axis • normal P waves • height < 2.5 mm in lead II • width < 0.11 s in lead II • for abnormal P waves see right atrial hypertrophy, left atrial hypertrophy, atrial premature beat, hyperkalaemia
normal PR interval • 0.12 to 0.20 s (3 - 5 small squares) • for short PR segment consider Wolff-Parkinson-White syndrome or Lown-Ganong-Levine syndrome (other causes - Duchenne muscular dystrophy, type II glycogen storage disease (Pompe's), HOCM) • for long PR interval see first degree heart block and 'trifasicular' block • normal QRS complex • < 0.12 s duration (3 small squares) • for abnormally wide QRS consider right or left bundle branch block, ventricular rhythm, hyperkalaemia, etc. • no pathological Q waves • no evidence of left or right ventricular hypertrophy
normal QT interval • Calculate the corrected QT interval (QTc) by dividing the QT interval by the square root of the preceeding R - R interval. Normal = 0.42 s. • Causes of long QT interval • myocardial infarction, myocarditis, diffuse myocardial disease • hypocalcaemia, hypothyrodism • subarachnoid haemorrhage, intracerebral haemorrhage • drugs (e.g. sotalol, amiodarone) • hereditary • Romano Ward syndrome (autosomal dominant) • Jervill + Lange Nielson syndrome (autosomal recessive) associated with sensorineural deafness
normal ST segment • no elevation or depression • causes of elevation include acute MI (e.g. anterior, inferior), left bundle branch block, normal variants (e.g. athletic heart, Edeiken pattern, high-take off), acute pericarditis • causes of depression include myocardial ischaemia, digoxin effect, ventricular hypertrophy, acute posterior MI, pulmonary embolus, left bundle branch block
normal T wave • causes of tall T waves include hyperkalaemia, hyperacute myocardial infarction and left bundle branch block • causes of small, flattened or inverted T waves are numerous and include ischaemia, age, race, hyperventilation, anxiety, drinking iced water, LVH, drugs (e.g. digoxin), pericarditis, PE, intraventricular conduction delay (e.g. RBBB)and electrolyte disturbance. • normal U wave
Acute inferior myocardial infarction • ST elevation in the inferior leads II, III and aVF • Reciprocal ST depression in the anterior leads
A 63 year old woman with 10 hours of chest pain and sweating
Acute anterior myocardial infarction • ST elevation in the anterior leads V1 - 6, I and aVL • reciprocal ST depression in the inferior leads
Acute posterior myocardial infarction • (hyperacute) the mirror image of acute injury in leads V1 - 3 • (fully evolved) tall R wave, tall upright T wave in leads V1 -3 • usually associated with inferior and/or lateral wall MI
Old inferior myocardial infarction • a Q wave in lead III wider than 1 mm (1 small square) and • a Q wave in lead aVF wider than 0.5 mm and • a Q wave of any size in lead II
Left ventricular hypertrophy (LVH) There are many different criteria for LVH • Sokolow + Lyon (Am Heart J, 1949;37:161) • S V1+ R V5 or V6 > 35 mm • Cornell criteria (Circulation, 1987;3: 565-72) • SV3 + R avl > 28 mm in men • SV3 + R avl > 20 mm in women • Framingham criteria (Circulation,1990; 81:815-820) • R avl > 11mm, R V4-6 > 25mm • S V1-3 > 25 mm, S V1 or V2 + • R V5 or V6 > 35 mm, R I + S III > 25 mm • Romhilt + Estes (Am Heart J, 1986:75:752-58) • Point score system
Left atrial abnormality (dilatation or hypertrophy) • M shaped P wave in lead II • prominent terminal negative component to P wave in lead V1 (shown here)
A 75 year old lady with loud first heart sound and mid-diastolic murmur
Mitral Stenosis • Atrial fibrillation: • No P waves are visible. • The rhythm is irregularly irregular (random). • Right ventricular hypertrophy: • Right axis deviation • Deep S waves in the lateral leads • Dominant R wave in lead V1 (not shown here) • The combination of Atrial Fibrillation and Right Axis Deviation on the ECG suggests the possibility of mitral stenosis.
left anterior hemiblock • QRS axis more left than -30 degrees • initial R wave in the inferior leads (II, III and aVF) • absence of any other cause of left axis deviation • left ventricular hypertrophy • In the presence of left anterior hemiblock the diagnostic criteria of LVH are changed. Rosenbaum suggested that an S wave in lead III deeper than 15 mm as predictive of LVH. • long PR interval (also called first degree heart block) • PR interval longer than 0.2 seconds
left atrial hypertrophy • M shaped P wave in lead II • P wave duration > 0.11 seconds • terminal negative component to the P wave in lead V1
2 to 1 AV block • every other P wave is conducted to the ventricles • 2 to 1 AV block starts after the 5th QRS in this 3 channel recording. The first non-conducted P wave is indicated with an arrow. • the PR interval of conducted P waves is constant • in this lady there is a long PR interval (and left bundle branch block) • 2 to 1 AV block cannot be classified into Mobitz type I or II as we do not know if the 2nd P wave would be conducted with the same or longer PR interval
Complete Heart Block • P waves are not conducted to the ventricles because of block at the AV node. The P waves are indicated below and show no relation to the QRS complexes. They 'probe' every part of the ventricular cycle but are never conducted. • The ventricles are depolarised by a ventricular escape rhythm
Atrial fibrillation and complete heart block • Fibrillary waves of atrial fibrillation and no P waves. • Regular ventricular rhythm • The wider the QRS of the ventricular escape rhythm the less reliable the escape mechanism. • AF with complete heart block can be easily missed and is an indication for a permanent pacemaker
Right Bundle Branch Block • wide QRS, more than 120 ms (3 small squares) • secondary R wave in lead V1 • other features include slurred S wave in lateral leads and T wave changes in the septal leads
left anterior hemiblock • QRS axis more left than -30 degrees • initial R wave in the inferior leads (II, III and aVF) • absence of any other cause of left axis deviation • left ventricular hypertrophy • In the presence of left anterior hemiblock the diagnostic criteria of LVH are changed. Rosenbaum suggested that an S wave in lead III deeper than 15 mm as predictive of LVH. • long PR interval (also called first degree heart block) • PR interval longer than 0.2 seconds • left atrial hypertrophy • M shaped P wave in lead II • P wave duration > 0.11 seconds • terminal negative component to the P wave in lead V1
Acute myocardial infarction in the presence of left bundle branch block • Features suggesting acute MI • ST changes in the same direction as the QRS (as shown here) • ST elevation more than you'd expect from LBBB alone (e.g. > 5 mm in leads V1 - 3) • Q waves in two consecutive lateral leads (indicating anteroseptal MI) Sgarbossa EB et al, N Engl J Med 1996;334:481-7
'Trifasicular' block • Complete Right Bundle Branch Block • Left Anterior Hemiblock • Long PR interval • The combination of RBBB, LAFB and long PR interval has been called 'trifasicular' block and implies that conduction is delayed in the third fascicle (in this case the left posterior fascicle) and a permanent pacemaker may be needed. However there are other causes of a long PR interval such as delayed conduction in the AV node or atrium so 'trifascicular block' is not a true ECG diagnosis.
Sinus bradycardia • P wave rate of less than 60 bpm • the rate in this example is about 45 bpm • Acute inferior MI and Right Bundle Branch Block are also present.
Sinus tachycardia • P wave rate greater than 100 bpm
Atrial Bigeminy • each beat is followed by an atrial premature beat
Atrial fibrillation with rapid ventricular response • Irregularly irregular ventricular rhythm. • Sometimes on first look the rhythm may appear regular but on closer inspection it is clearly irregular.