Discover the Mystery of Seasons Through Engaging Activities
130 likes | 238 Vues
Explore the science behind the changing seasons with this interactive lesson plan designed for 7th-grade students. The lesson includes hands-on activities, rotation and revolution simulations, smart board interactions, model building, and assessments. By the end of the lesson, students demonstrate a significant improvement in their understanding of Earth's seasonal changes. Data analysis reveals a positive impact on student learning, with most showing a shift from lower grades to an A. The lesson fosters group engagement and individual learning support, catering to different student needs. Reflection on the lesson highlights successful elements like student enthusiasm for games, interactive activities, and collaborative model checking. Differentiation through diverse learning styles and modifications by the intervention specialist enhance the overall learning experience.

Discover the Mystery of Seasons Through Engaging Activities
E N D
Presentation Transcript
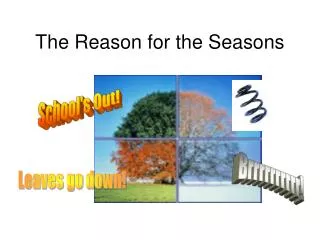
The reason for the seasons! By: Melanie Byers
School Information • Our school has a little over 1000 students 35% of which are on free or reduced lunch. • predominately white • I teach 7th grade science • I have about 100 students • I have one Arabic speaking student, and I have 15 students with learning disabilities
Indicator Standard: Earth and space science, benchmark A, Indicator 1 Describe how objects in the solar system are in regular and predictable motions that explain such phenomenon as days, years and you guessed it, SEASONS!
Lesson Overview • Play winter spring summer or fall song • Pre test • Student directed season model (act out using props) • Rotation/ revolution Simon Says game • Direct instruction using earth ball and sun puppet • Interactive smart bd. activity • Model building (including 23.5degree tilt) and rotation direction • Student check of each others’ models • Rotation/ revolution flash cards with pictures, season drawings • Post test
Assessments: • Formative: Pre-test, Simon says, model making, Smart board activity, flash cards with pictures, questions while facilitating small groups Summative: Post test, drawings
Data Interpretation • Most class averages went from a D or an F to an A on the pre/ post test!!!!! • The inclusion class had the largest increase in scores. YES! • Almost all students did very well on the seasons drawings. The drawings showed me who needed help with understanding and I helped them on an individual basis. • 7 students still missed the question about what celestial body is in the middle of the solar system. Hmm I guess I needed to stress where the sun is located. • The data tells me that the lesson was successful. Most points lost were on the short answer because I expected detailed explanations as to why Ohio experiences a change in seasons. • My students could use help writing short answer responses.
Overall reflection • This lesson went well and as always it improved throughout the day. • Students LOVED the rotation and revolution game. They were eager to tell who was out! • The smart board interactive activity was a hit as well. • Kids became a little frustrated trying to measure the 23.5degree angle and needed a little more direct instruction on how to use the protractor. • The summative assessments showed that students did in fact increase understanding of the cause of the seasons. • Checking each others’ models worked out great and the students were into it. • Two weeks after the lesson one of my “cool” students told me that he heard that “fall song” at Meijer. Maybe he was touched by music • Differentiation was embedded in the lesson through heterogeneous grouping and by addressing a variety of learning styles. • Modifications were made as needed by the intervention specialist.