Market microstructure
Market microstructure. Fabrizio Lillo Finanza Quantitativa SNS – 20 Aprile 2011. Market microstructure.

Market microstructure
E N D
Presentation Transcript
Market microstructure Fabrizio Lillo FinanzaQuantitativa SNS – 20Aprile 2011
Market microstructure • Market microstructure “is devoted to theoretical, empirical, and experimental research on the economics of securities markets, including the role of information in the price discovery process, the definition, measurement, control, and determinants of liquidity and transactions costs, and their implications for the efficiency, welfare, and regulation of alternative trading mechanisms and market structures” (NBER Working Group)
Garman (1976) • “We depart from the usual approaches of the theory of exchange by (1) making the assumption of asynchronous, temporally discrete market activities on the part of market agents and (2) adopting a viewpoint which treats the temporal microstructure, i.e. moment-to-moment aggregate exchange behavior, as an important descriptive aspect of such markets.”
Characteristics • Securities value comprises private and common components • Common: cash flow • Private: Information, investment horizon, risk exposure • Heterogeneous private values • Specific about the market mechanism • Multiple characterization of prices (no Walrasiantatonnement)
Liquidity • Elasticity • Cost of trading • “Depth, breadth, and resiliency” • Above the current market price there is a large incremental quantity for sale • Many market participants, none with significant market power • Price effects die out quickly • Liquidity suppliers (sell side: brokers, dealers, intermediaries) • Liquidity demanders (buy side: individuals and institutional investors) • Market (liquidity) consolidation vs fragmentation • “Liquidity is a lot like pornography: we know it when we see it and we can measure it even if we do not know how to define it” (Lehman)
The Questions (Hasbrouck) • What are the optimal trading strategies for typical trading problems? • Exactly how is information impounded in prices? • How do we enhance the information aggregation process? • How do we avoid market failures? • What sort of trading arrangements maximize efficiency? • How is market structure related to the valuation of securities? • What can market/trading data tell us about the informational environment of the firm? • What can market/trading data tell us about long term risk?
Financial data • In the last thirty years the degree of resolution of financial data has increased • Daily data • Tick by tick data • Order book data • “Agent” resolved data • High frequency data are like a powerful microscope -> Change in the nature of social sciences ? • High frequency data require sophisticated stochastic modeling and statistical techniques
Daily data • Daily financial data are available at least since nineteenth century • Usually these data contains opening, closing, high, and low price in the day together with the daily volume • Standard time series methods to investigate these data (from Gopikrishnan et al 1999)
Tick by tick data • Financial high frequency data usually refer to data sampled at a time horizon smaller than the trading day • The usage of such data in finance dates back to the eighties of the last century • Berkeley Option Data (CBOE) • TORQ database (NYSE) • HFDF93 by Olsen and Associates (FX) • CFTC (Futures)
Higher resolution means new problems • data size: example of a year of a LSE stock • 12kB (daily data) • 15MB (tick by tick data) • 100MB (order book data) • the total volume of data related to US large caps in 2007 was 57 million lines, approximately a gigabyte of stored data • A large cap stock in 2007 had on average 6 transactions per second, and on the order of 100 events per second affecting the order book • irregular temporal spacing of events • the discreteness of the financial variables under investigation • problems related to proper definition of financial variables • intraday patterns • strong temporal correlations • specificity of the market structure and trading rules.
Data size Irregular temporal spacing Periodicities Temporal correlations
More structured data require more sophisticated statistical tools • data size: • more computational power • better filtering procedures • irregular temporal spacing of events • point processes, ACD model, CTRW model… • the discreteness of the financial variables under investigation • discrete variable processes • problems related to proper definition of financial variables • intraday patterns • strong temporal correlations • market microstructure • specificity of the market structure and trading rules. • better understanding of the trading process
Trading mechanisms • A trade is a preliminary agreement which sets in motion the clearing and settlement procedures that will result in a transfer of securities and funds • Trading often involves a broker which may simply provide a conduit to the market but may also act as the customer’s agent. • Principal-agent relationship • The broker’s duty is “best execution”: it provides credit, clearing services, information, analytics. Usually it is not a counterparty.
Limit order book • Many stock exchanges (NYSE, LSE, Paris) works through a double auction mechanism • Different levels of transparency (recent at NYSE). Hidden and Iceberg orders • Many order books vs a consolidated limit order Book • Price-time priority • Walk the book
Representation of limit order book dynamics (Ponzi, Lillo, Mantegna 2007)
Floor market • Old market structure • Now used only in US commodity futures markets (Chicago Board of Trade, New York Mercantile Exchange, Chicago Mercantile Exchange) • Little transparency on data • Bund futures at London International Financial Futures Exchange (LIFFE) and Eurex (1997)
Dealer market • A dealer is an intermediary who is willing to act as a counterparty for the trades of his customers • Foreign exchange, corporate bond, swap markets • Customers cannot typically place limit orders • A large customer can have relationships with many competing dealers • Low transparency: quotes in response to customer inquiries and not publicly available • Interdealer trading is also important (for dealer inventory management). Limit order book for FX • Dealers facilitate large (block) trades. Upstairs or off book market
Crossing networks • A buyer and a seller are paired anonymously for an agreed-on quantity • The trade is priced by reference to a price in another (typically the listed) market • ITG’s POSIT, INSTINET, etc..
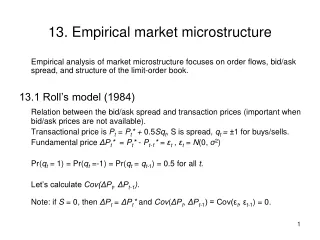
Roll model (1984) • “It illustrates a dichotomy fundamental to many microstructure models: the distinction between price components due to fundamental security value and those attributable to the market organization and trading process” • It is also didactic in showing how to go from a structural model to a statistical model
Roll model (1984) • Random walk model of the efficient price where ut is an i.i.d. noise with variance s2u • All trades are conducted through a dealer who posts bid and ask prices • Dealer incurs a noninformational cost c per trade (due to fixed costs: computers, telephone) • The bid and the ask are and thus the spread is 2c
The transaction price pt is where qt=+1 (-1) if the customer is buyer (seller). Moreover qt are assumed serially independent. • The variance of transaction price increments is • The autocovariance of transaction price increments is and it is zero for lag larger than one
For example (Hasbrouck) the estimated first order covariance for PCO (Oct 2003) is g1=-0.0000294, which implies c=$0.017 and a spread 2c=$0.034. The time weighted spread is $0.032 • Roll model was used to determine the spread from transaction data Autocorrelation function of transaction price returns (solid circles), absolute value of transaction price returns (open circles), returns of midprice sampled before each transaction (filled triangles), and returns of midprice sampled at each market event (filled squares) for the AstraZeneca (AZN) stock traded at LSE in 2002. The lags on the horizontal line are measured in event time.
Time series perspective • The autocovariance structure of transaction price increments in the Roll model is the same as in a MA(1) process • The Roll model is a structural model, while its time series representation is a statistical model • By assuming covariance stationarity we can use the Wold theorem: any zero-mean covariance stationary process can be represented as where et is a zero mean white noise process and kt is a linearly deterministic process (can be predicted arbitrarily well by a linear projection on past observation of xt)
In the Roll model: • everyone possesses the same information • trades have no impact • Trading is not a strategic problem because agents always face the same spread • Cost is fixed and uninformational
Asymmetric information models • The security payoff is usually of a common value nature • The primary benefit derived from ownership of the security is the resale value or terminal liquidating divi- dend that is the same for all holders • But for trade to exist, we also need private value components, that is, diversification or risk exposure needs that are idiosyncratic to each agent
Public information initially consists of common knowledge concerning the probability structure of the economy, in particular the unconditional distribution of terminal security value and the distribution of types of agents • As trading unfolds, the most important updates to the public information set are market data, such as bids, asks, and the prices and volumes of trades • The majority of the asymmetric information models in microstructure examine market dynamics subject to a single source of uncertainty • Thus, the trading process is an adjustment from one well-defined information set to another (no stationarity, ergodicity, time-homogeneity)
Sequential trade models: randomly selected traders arrive at the market singly, sequentially, and independently. (Copeland and Galai (1983) and Glosten and Milgrom (1985)). • When an individual trader only participates in the market once, there is no need for her to take into account the effect her actions might have on subsequent decisions of others. • Strategic trader models: A single informed agent who can trade at multiple times. • A trader who revisits the market, however, must make such calculations, and they involve considerations of strategy • In both models a trade reveals something about the agent’s private information
Strategic model: Kyle (1985) • The model describes a case of information asymmetry and the way in which information is incorporated into price. • It is an equilibrium model • There are several variants: single period, multiple period, continuous time • The model postulates three (types of) agents: an informed trader, a noise trader, and a market maker (MM)
The terminal (liquidation) value of the asset is v, normally distributed with mean p0 and variance S0. • The informed trader knows v and enters a demand x • Noise traders submit a net order flow u, normally distributed with mean 0 and variance s2u. • The MM observes the total demand y=x+u and then sets a price p. All the trades are cleared at p, any imbalance is exchanged by the MM.
The informed trader wants to trade as much as possible to exploit her informational advantage • However the MM knows that there is an informed trader and if the total demand is large (in absolute value) she is likely to incur in a loss. Thus the MM protects herself by setting a price that is increasing in the net order flow. • The solution to the model is an expression of this trade-off
Informed trader • The informed trader conjectures that the MM uses a linear price adjustment rule p=ly+m, where lis inversely related to liquidity. • The informed trader’s profit is p=(v-p)x=x[v-l(u+x)-m] and the expected profit is E[p]=x(v-lx-m) • The informed traders maximizes the expected profit, i.e. x=(v-m)/2l • In Kyle’s model the informed trader can loose money, but on average she makes a profit
Market maker • The MM conjectures that the informed trader’s demand is linear in v, i.e. x=a+bv • Knowing the optimization process of the informed trader, the MM solves (v-m)/2l=a+bv a=-m/2l b=1/2l • As liquidity drops the informed agent trades less • The MM observes y and sets p=E[v|y]
Solution • If X and Y are bivariate normal variables, it is E[Y|X=x]=mY+(sXY/sx2)(x-mX) • This can be used to find E[v|y]=E[v|u+a+bv] • The solution is
Solution (II) • The impact is linear and the liquidity increases with the amount of noise traders • The informed agent trades more when she can hide her demand in the noise traders demand • The expected profit of the informed agent depends on the amount of noise traders • The noise traders loose money and the MM breaks even (on average)
Kyle model - summary • The model can be extended to multiple periods in discrete or in continuous time • The main predictions of the model are • The informed agent “slices and dices” her order flow in order to hide in the noise trader order flow • Linear price impact • Uncorrelated total order flow • Permanent and fixed impact
Current microstructural paradigm • There are two types of traders: informed and uninformed • Informed traders have access to valuable information about the future price of the asset (fundamental value) • Informed traders sell (buy) over- (under-)priced stocks making profit AND, through their own impact, drive quickly back the price toward its fundamental value • Examples: Kyle, Glosten-Milgrom • In this way information is incorporated into prices, markets are efficient, and prices are unpredictable
Current paradigm mispricing D news arrives
Is this the right explanation? Orders of magnitude • Information • How large is the relative uncertainty on the fundamental value? 10-3 or 1 (Black 1986) • Financial experts are on the whole pretty bad in forecasting earnings and target prices • Many large price fluctuations not explained by public news • Time • Time scale for news: 1 hour-1day (?) • Time scale for trading: 10-1s:100s • Time scale for market events: 10-2:10-1s • Time scale for “large” price fluctuations: 10 per day • Volume • Daily volume: 10-3:10-2 of the market capitalization of a stock • Volume available in the book at a given time: 10-4:10-5 of the market capitalization • Volume investment funds want to buy: up to 1% of a company
Consequences • Financial markets are in a state of latent liquidity, meaning that the displayed liquidity is a tiny fraction of the true (hidden) liquidity supplied/demanded • Delayed market clearing: traders are forced to split their large orders in pieces traded incrementally as the liquidity becomes available • Market participants forms a kind of ecology, where different species act on different sides of liquidity demand/supply and trade with very different time scales
Mechanical price formation “Market” Price impact • Price impact is the correlation between an incoming order and the subsequent price change • For traders impact is a cost -> Controlling impact • Volume vs temporal dependence of the impact Order flow Price process
Price (or market) impact • Price impact is the correlation between an incoming order and the subsequent price change • For traders impact is a cost -> Controlling impact • Volume vs temporal dependence of the impact
Why price impact? • Given that in any transaction there is a buyer and a seller, why is there price impact? • Agents successfully forecast short term price movements and trade accordingly (i.e. trade has no effect on price and noise trades have no impact) • The impact of trades reveals some private information (but if trades are anonymous, how is it possible to distinguish informed trades?) • Impact is a statistical effect due to order flow fluctuations (zero-intelligence models, self-fulfilling prophecy) “Orders do not impact prices. It is more accurate to say that orders forecast prices” (Hasbrouck 2007)
Market impact • Market impact is the price reaction to trades • However it may indicate many different quantities • Price reaction to individual trades • Price reaction to an aggregate number of trades • Price reaction to a set of orders of the same sign placed consecutively by the same trader (hidden order) • Price reaction in a market to a trade in another market (e.g. electronic market and block market)
Volume and temporal component of market impact of individual trades • Market impact is the expected price change due to a transaction of a given volume. The response function is the expected price change at a future time
Master curve for individual impact NYSE London Stock Exchange Impact of individual transaction is NOT universal Paris Bourse (Potters et al. 2003) Individual market impact is a concave function of the volume
Master curve for individual impact (Lillo et al. Nature 2003) GROUP A -> least capitalized groupGROUP T -> most capitalized group NYSE
Price impact from book shape Let indicate the cumulative number of shares (depth) up to price return r A market order of size V will produce a return For example if then the price impact is