Project Scheduling for Load Testing Bridges
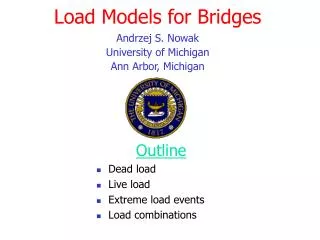
Project Scheduling for Load Testing Bridges. for ENCE 667 Course Project Spring 2001 Justin Myers. Overview of the Bridge. Early 1900’s concrete slab construction Inspected every two years Up to 21 1 / 2 ” of asphalt wearing surface Significant “Dead Load”


Project Scheduling for Load Testing Bridges
E N D
Presentation Transcript
Project Scheduling for Load Testing Bridges for ENCE 667 Course Project Spring 2001 Justin Myers
Overview of the Bridge • Early 1900’s concrete slab construction • Inspected every two years • Up to 21 1/2” of asphalt wearing surface • Significant “Dead Load” • 2000 ADT is 2250, mostly heavy vehicles • Local town needs large emergency vehicles to cross over.
“Dead Load” Definition: Continuous Loads applied to the bridge. Loads are caused from the weight of the bridge elements themselves that are permanently fixed into the bridge.
Actions and Findings • Action • Analysis of bridge’s structural capacity • Used Am.Assoc. of Highway and Transportation Officials (AASHTO) guidelines • Finding • Bridge lacked enough structural capacity based on AASHTO guidelines.
Inadequate Capacity Due to • Significant amount of asphalt • Limited capacities and engineering calculation constraints set in AASHTO’s guidelines.
Objective: • Allow all traffic to cross over the bridge. • What are some of our office’s possible solutions????
Possible Solution Options: • Replace the entire bridge • Load Test the bridge • Do nothing and detour heavy vehicles
Option 1: Replace the Bridge • Bridge with greater structural capacity could be built. • Funding would be difficult.
Option 2: Load Test the Bridge • Non-destructive test • Determines actual capacity • Load Testing found 85% of bridges adequate • If Load Test finds inadequate, no chance of meeting AASHTO guidelines
Option 3: Do Nothing • Option is always considered in decision making • Consequence - heavy vehicles detoured
Management wanted to know probability • Used Bayes Rule S1 = Adequate capacity by Load Test. S2 = Inadequate capacity by Load Test. T1 = Bridge meets AASHTO guidelines T2 = Bridge does not meet AASHTO guidelines.
Given • P(S1) = 0.85 P(S2) = 0.15 • P(T1/S1) = 0.99 P(T2/S1) = 0.01 • P(T1/S2) = 0 P(T2/S2) = 1.0
Find • P(S1/T2) • Using Bayes Rule: • P(S1/T2) = 5.362 %
Outcomes of Load Testing: • Although Low probability (i.e. < 10%) • Data for possible replacement in the future. • Less costly than replacement • Minimal time to conduct relative to replacement time • Quality of Load Test is accurate.
Load Test Project • Duration was important • Done efficiently and accurately. • Cost insignificant to replacement. • Develop a Critical Path Method (CPM)
Potential Problems • Weather • Using consultant as a sub-consultant. • Communication between the prime and sub-consultants
Critical Path Method: • ID all Load Test tasks - refer to handouts. • Variation in activity durations due to communication between certain departments. • Sketched AOA network of project.
Conclusion • Critical Path = 57 days
Probability of project finishing in 50 days. • Use Central Limit Theorem. • Only 8.23% chance of project finishing within 50 days. • Management dismissed the idea.
Management Goals • Project Duration after Load Test less than 30 days. • Cost of Load Test and data analysis not to exceed $20,000
Given Cost Parameters • $55/hr for consultant services • $500/hr for use of contractor • Each hour exceeded for 30 day timeframe in consultant analysis = $100 • Each hour that failed to meet the 2 day requirement for contractor = $100 • Each hour exceeded for the 2 day requirement for contractor = $250
Determinations • Model found consultants could use up to 218 hours (27 days) to complete Load Test data analysis. • Consultants estimated 100 hours for Load Test analysis. • Consultants would have 15 “slack” days for other projects.
Load Test Project Results • Load Test set-up activities and testing completed on time • Delays caused by “higher precedent” projects in consultants’ company. • Consultants’ report completed 38 days after the Load Test.
Load Test Project Results (continued) • Bridge had adequate capacity • Consultants were penalized • Suggestions to delay dilemma: • increase disincentives constraints in design contract • higher precedence for Load Test data analysis