Landsat TM Imagery Analysis: Cloud Cover & Quality from 1982 to 2000
200 likes | 313 Vues
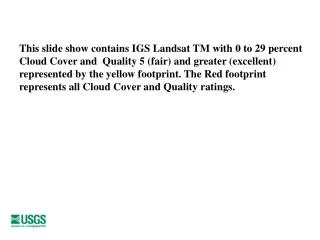
This slideshow presents an analysis of Landsat TM imagery with 0-29% cloud cover and a quality rating of fair (5) and above, highlighted by the yellow footprints. In contrast, the red footprints represent all cloud cover and quality ratings for various periods from September to November over several years, specifically from 1982 to 2000. This comprehensive dataset aids in understanding long-term satellite imagery quality and cloud cover trends, crucial for environmental monitoring and geographic research.

Landsat TM Imagery Analysis: Cloud Cover & Quality from 1982 to 2000
E N D
Presentation Transcript
This slide show contains IGS Landsat TM with 0 to 29 percent Cloud Cover and Quality 5 (fair) and greater (excellent) represented by the yellow footprint. The Red footprint represents all Cloud Cover and Quality ratings for the period.