Download
1 / 20
200 likes | 328 Vues
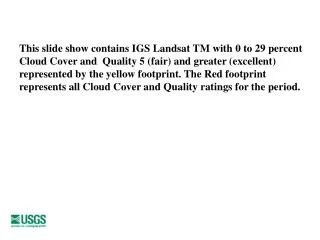
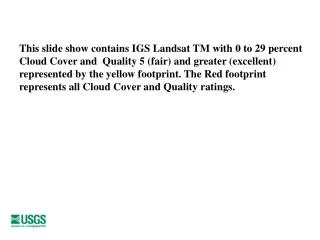
This slide presents an analysis of Landsat TM data from 1982 to 2000, focusing on images with 0 to 29 percent cloud cover and a minimum quality rating of 5 (fair) or higher, represented by the yellow footprint. The red footprint indicates all cloud cover and quality ratings. This comprehensive dataset provides insights into the changes over the years, aiding researchers and environmentalists in understanding landscape dynamics and land use changes affected by varying cloud cover and quality levels.

E N D
This slide show contains IGS Landsat TM with 0 to 29 percent Cloud Cover and Quality 5 (fair) and greater (excellent) represented by the yellow footprint. The Red footprint represents all Cloud Cover and Quality ratings.