Exploratory Data Analysis & Visualization Techniques for Big Data Challenges in Paris
Explore data embedding and graph visualization methods for big data mining in this conference featuring top experts in the field. Discover algorithms for preserving topological features in high-dimensional data representations and learn about computational complexities and effective visualization strategies.

Exploratory Data Analysis & Visualization Techniques for Big Data Challenges in Paris
E N D
Presentation Transcript
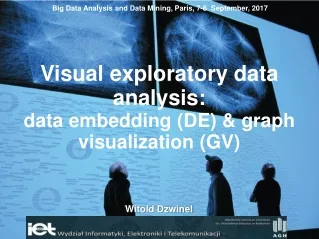
Big Data Analysis and Data Mining, Paris, 7-8 September, 2017 Visual exploratory data analysis: data embedding (DE) & graph visualization (GV) Witold Dzwinel
Visual data mining (VDM) [Felizardo et al. 2012] • Hypotheses verification • ML algorithms adaptation and tuning • Matching the best data representation
The problem How to preserve in 2-D the main topological features of these data representations? • the neigborhood (fine grained) • the cluster structure (coarse grained) Visualization of two data representations in 2-D (3-D) Euclidean space: • high dimensional data (HD) ↔ M, N-D feature vectors Y (data embedding DE) • complex networks G(V,E,W) (graph visualization GV) • N, M, #V, #E → are huge
HD Embedding: Y → X dissimilarity matrix representation of data
Bottlenecks • Storage and Computational complexities • Manifold problem • Curse of dimensionality (O(M2) & O(MlogM) e.g. based on stochastic neighbor embedding: bh-SNE, q-SNE, w-SNE, LargeVis etc. and forceatlas based GV algorithms )
Computational complexity Existing VE and GV methods based on distances are strongly overdetermined. • in 2-D at least: ~2◦ M distances can define the stable solution for rigid graphs Which distances?????
HDD ↔ graph representation k-nearest neighbor graphs ↔ DE k-NN graph is not rigid!! Other distances are necessary for k-NN graph visualization
Computational complexity We propose a drastic simplification of distances matrix i (i data vector or graph vertex), find the small sets of for DE: NN(i) of the k-nearest and RN(i) r - random neighbors for GV: all-connected NN(i) and r-disconnected RN(i) vertices We assume that k+r ~ N (dimensionality of Y) It gives O(M) linear-time & memory complexity of both DE and GV algorithms
Curse of dimensionality 1.Increase the contrast between the nearest (connected) and the random neighbors (vertices) 2. Use force-directed method for minimization of the stress function
Examples: MNIST T=11 min T=30 min T<1 min
Examples: NORB (small) M=43600, N=2048 The NORB dataset (NYU Object Recognition Benchmark) contains stereo image pairs of 50 uniform-colored toys under 18 azimuths, 9 elevations, and 6 lighting conditions
DBN - autoencoder 30 min [Snoek et al., 2012]
Autoencoder, Snoek et al.2012 NORB: 1m Van der Maaten, 2014
Examples: Reuters t-SNE (M~58000, N=2000) 5h
Examples: Reuters 5 min
Complex networks visualization Historic articles from Wikipedia and links between them.
2167.88 sec. State_of_the_art 250 sec. http://yifanhu.net/index.html AT&T Labs -- Research
Conclusions 1. Low memory complexity O(nM) 2. Low computational complexity O((n+r)M) 3. High level of parallelization (PM) 4. Easy implementation on Big data platforms (Hadoop, Apache Spark) 5. Near neighbors (NeN) instead of NN! 6. Big graphs visualization
We have ... 1. Desktop versions with GUI for interactive visualization of large HD data (IVTA) and GV (IVGA). 2. Ultrafast methods for k-NN neighbor search implemented in CUDA. 3. GV parallel (CUDA, MPI) software employing B-matrices and algebraic graph representations. 4. Feature extraction software (CUDA) based on DBNs.
Future work 1. Developing VE and GV systems for distributed data visualization involving big data architectures (Hadoop, Spark …). 2. Employing algebraic descriptors for data analytics, and new data manipulation techniques 3. Using our DBN software for data preprocessing, i.e., feature extraction for big distributed data repositories
Acknowledgments.This research is supported by the Polish National Center of Science (NCN) project #DEC-2013/09/B/ST6/01549.