Visualization and Analysis Workflow
Visualization and Analysis Workflow. December 14, 2009 Draft. /ber. The concept of a Workflow. Express the analysis of plant systems in terms of the data and operations on those data Multiple types of data (e.g., experimental, computed, archival)


Visualization and Analysis Workflow
E N D
Presentation Transcript
Visualization and Analysis Workflow December 14, 2009 Draft /ber
The concept of a Workflow • Express the analysis of plant systems in terms of the data and operations on those data • Multiple types of data (e.g., experimental, computed, archival) • Mutliple types of operations (e.g., analytical, visualization, search) • Treat the data and operations as components, which can be re-used, replaced, augmented, and extended.
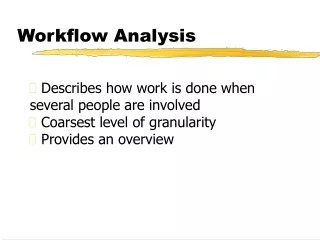
Workflow A pathway of operations Entities: Operation Data Flow The flow through the operations is managed by the workflow software (e.g., VizTrails)
Multi-layer workflows Conceptual Level: High-level representation for casual users, with lots of defaults pre-selected List of genes Network Co-expression analysis Professional Level: Visibility into underlying workflows, with freedom to select tools and parameters Pathways Analysis of omics data List of genes Network Statistical analysis tool Interactive Visual Analysis Metabolites Infrastructure Level: The explicit treatment of underlying data, databases, data integration, tools, operations, parameters, defaults, wrappers, provenance, interconnectivity, access, etc.
VizTrails- a candidate workflow architecture Professional workflow • Visual programming interface for representing data and operations as workflows • Loose coupling, using parameterizable Python wrappers • Extensible, flexible, re-usable components and workflows • Coupled with an attractive, flexible User Interface (to be developed) Provenance and metadata Conceptual workflow Interactive visualizations
Example Workflows from iPLANT team • Goals: • Demonstrate the use of a workflow model for representing the data and processes in plant genomic research exploration • Provide a common structure for iPLANT use cases • Help define requirements for data integration • Motivate discussions about analysis that join multiple types of data, allow users to interact dynamically, and provide interactive painting across visual representations (e.g., painting a metabolic pathway with gene expression magnitude)
Workflow for Maize Gene Analysis Modeling and Statistical Inference Candidate maize gene Homolog Finder (e.g, CoGE) Literature search List of homologous Arabadopsis gene IDs iterate Co-Expression Analysis (e.g., ATTED2) Examine clusters that can handle maize data (e.g., eNorthern, MapMan) 5 genes of interest Expression Network of 10 Arabidopsis Genes note: very limited data for maize so may need to go to rice For each, examine structure of transcripts and expression over time (e.g, EFP Maize Genome Browser) Homolog Finder (e.g, CoGE) Find expression values for these genes (e.g, Next Gen) Expression data for 20 maize genes List of 20 homogolous maize gene IDs /tb/ber
Workflow for Analysis of Omics Data in a Model Species Visually-identifed, cell-based, network regions of interest Visually-identified enriched pathways Gene expression data Expression Analysis Metabolite Data • Integrated gene expression and metabolomic data • Interactive visual and statistical analysis • Explicit support for iterative what-if analysis Identify sub-cellular locations of gene products (e.g., Interactome) Interactive Visual &Statistical Analysis (e.g., ViVA, Co-expression analysis, PlantMetGenMap, Gene Mania) Inferred Protein-Protein interactions Visually identified genes and metabolites to map onto functional pathways iterate iterate Visualize Visualize Testable Hypotheses /rg/ber
Other Data Sources to be Incorporated 1. Motifs from Regulatory Regions in Model Species 2. Cell-specific Expression 3. Pathways Wiki, place gene(s) of interest in established pathways. 4. Metabolites, incorporate information from Reactome 5. Literature , PubMed Assistant??? Depiction Needed Displays of inferred regulatory networks, as in Gene Mania.
Analysis of Gene Expression from A Partially Sequenced Species 7 Formulate mechanistic models 1 2 Experimental exposure of plants to stress Highly expressive genes Paint identified genes onto pathways (e.g., MapMan) Ecophysio-logical data 3 Identification of homologs in reference species (e.g. CoGe) 6 Meta Annotator: Explore known features of these genes (e.g. signaling pathways, eFP, literature) 4 Identification of candidate homologs that have been reported as co-expressed (e.g., statistical correlation) Visualization of enriched pathways 5 Compare magnitude of activity across reference pathways (e.g., PageMan,KEGG, GO, MapMan) Co-expressed genes for reference species /rg/ber