Optimizing HPC Systems: Holistic Performance Analysis and Lightweight Monitoring Insights
This review by Felix Wolf focuses on tuning objectives for High-Performance Computing (HPC) systems through holistic performance analysis. It covers essential success metrics, scientific output, and recent success stories illustrating performance and scalability improvements. Emphasizing stakeholder-centric approaches, the analysis highlights integrated workflows using HOPSA tools. The innovative Lightweight Monitoring Module (LWM2) monitors system performance, capturing inter-application interference and ensuring minimal overhead. Key techniques include profiling methodologies such as threads and communications monitoring, elevating performance consulting to benefit users significantly.

Optimizing HPC Systems: Holistic Performance Analysis and Lightweight Monitoring Insights
E N D
Presentation Transcript
Performance analysis workflow Final Review | Felix Wolf (GRS)
Tuning objectives for HPC systems • Success metrics • Scientific output (success stories) • Performance / scalability (e.g., record number of particles, Top500) • Focus different for different stakeholders
Holistic performance system analysis System-wide performance screening of individual jobs EU Russia
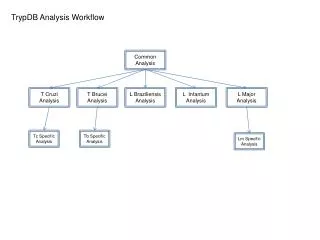
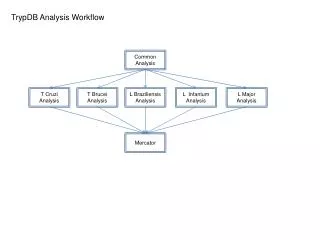
Overall HOPSA workflow Performance Screening Performance Diagnosis In-depth analysis Mandatory job screening with LWM2 and ClustrX User Intra-node performance Basic application + system metrics Paraver ThreadSpotter Job digest Application-leveltuning LAPTASystem performance database Vampir Inter-node performance Pro-active performance consulting Scalasca (Cube) Traces with application + system metrics Job Info of User Administrator Global workload data + job digests Full access System-level tuning LAPTA system-level analysis
Successive refinement of performance data Profile CUBE-4 Minimize intrusion 1 Identify pivotal iterations Visual exploration Time-series Profile CUBE-4 2 Instrument with Score-P Scalasca wait-state analysis System level 0 3 Dimemas what-if analysis Problem? Digest Event trace OTF-2 Node level Paraver Visual exploration ThreadSpotter Vampir
Tool integration Threadspotter Memory profile Application measured with ThreadSpotter Link memory +threadinganalysis Explore memory behavior Link Dimemas Profile CUBE-4 Visual exploration Worst-instance visualization Cube Application linked to Score-P What-if scenarios Scalasca wait-state analysis OTF2 to PRV conversion Trace PRV Trace OTF-2 Visual exploration Paraver Application measured with Extrae System metrics done to do LAPTA Vampir
Correlation of performance data across jobs App A System nodes App B • Time slices allow correlations between simultaneously running jobs to be identified App C Metric intensity App D Time-slices Correlation
Conclusion • Users will learn of performance problems early on • Users have guidance in applying the tools to tune their codes • Selection of tools • Order of application • Seamless integration • Way of distinguishing system from application issues • Also helped us to better structure our trainings
Light-Weight Measurement Module (LWM2) Final Review | Felix Wolf (GRS)
Outline • Introduction • Profiling methodology • Low overhead • Inter-application interference • Results
Lightweight Monitoring Module • Light-weight application profiler designed for system-wide performance screening of all jobs on a system • Key feature – allows identification of cross-application interferences • Designed for ease of use • Requires no application modification, compilation or relinking • Generates simple and useful performance output • Supports MPI, OpenMP and CUDA programming models
LW2M profiling methodology • Light-weight combination of • Direct instrumentation via interposition wrappers (only communication and I/O metrics, no time measurements) • Low-overhead sampling • Aggregation of data for • Every time slice (all metrics, except sampling based) • Whole execution (execution digest) Periodic samples Application Execution Time-slices MPI calls, HWCs, etc. MPI calls, HWCs, etc. MPI calls, HWCs, etc. MPI calls, HWCs, etc.
LWM2 profiling methodology (signals) • Signals counted separately per thread • Combined only at the end Thread storage Thread 1 Process storage Thread 0 Thread storage Thread 2
LWM2 profiling methodology (wrappers) • Data from wrappers is stored in separate storage • Data is aggregated in situ per time slice Wrapper calls Thread storage Thread 1 Combines data at the end of time-slice Wakes up at the end of time-slice Process storage Thread 0 Heart-beatthread Thread storage Aggregates data into time-slices Thread 2
LWM2 overhead • SPEC MPI 2007 benchmark suite
Inter-application interference • Applications on HPC system usually have • Exclusive access to processors, local memory • Shared access to communication network and I/O subsystem • Results in applications effecting each others performance • Not captured with classic performance analysis tools • Requires capturing performance of all applications running on a system • Possible with LWM2
File I/O interference • Setup: Simultaneous execution of application to detect I/O interference • Initial run: Constant file I/O alone, without any induced noise • Second run: Constant file I/O, concurrently with periodic file I/O as induced noise • Results: Clear drop in I/O performance (50%), longer execution time (35%)
LWM2 status • Development completed • Release published on HOPSA Web site • Opt-in deployments at • GraphIT system, Moscow State University • JUDGE, Jülich Supercomputing Center • Being evaluated at • Todiand Pilatus, CSCS, Switzerland • Indy, EPCC, UK (APOS) • Research publication with MSU under preparation