Download
1 / 29
290 likes | 430 Vues
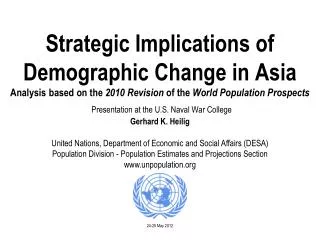
Strategic Implications of Demographic Change in Asia Analysis based on the 2010 Revision of the World Population Prospects Presentation at the U.S. Naval War College Gerhard K. Heilig.

E N D
Strategic Implications ofDemographic Change in AsiaAnalysis based on the 2010 Revision of the World Population ProspectsPresentation at the U.S. Naval War CollegeGerhard K. Heilig United Nations, Department of Economic and Social Affairs (DESA)Population Division - Population Estimates and Projections Sectionwww.unpopulation.org24-25 May 2012
Population and (International) Conflict 0 Adaptation “Diplomacy” Goal Attainment “War” Gain or preserve a position of power (political superiority) DOMINANCE Gain or preserve wealth (economic advantage) GREED Ideological, religious or ethical fanatism RAGE Integration “Institutionalization” Latency“Cultural Infiltration” 1. Population: Size / Structure / Distribution / Balance 2. Geography / Natural Environment: Location / Resources 3. Economic System: Market / Command & Control / Mixed 4. Political System: Democracy / Gerontocracy / Dictatorship Context Factors Source: United Nations, Department of Economic and Social Affairs, Population Division (2011): World Population Prospects, the 2010 Revision. New York
Absolute numbers (population size) Distribution (global balance) Concentration (urbanization) Structure (population ageing) How does Demography shape conflicts? 1 2 3 4
How does Demography shape conflicts? 1 Numbers
Change in Population: 1950-2100 (millions) 1 Source: United Nations, Department of Economic and Social Affairs, Population Division (2011): World Population Prospects, the 2010 Revision. New York
Total Population: 1950-2100 (millions) 1 Source: United Nations, Department of Economic and Social Affairs, Population Division (2011): World Population Prospects, the 2010 Revision. New York
How does Population Size shape conflicts? 1 With very large populations (billions of people) … • information gathering on adversaries has to be modified: more technology-oriented, better raster, better analytics • conflict strategy should be more diversity-conscious: large populations are usually much less homogenous than small nations • higher potential for (economic) primacy: population-rich countries can become economic, political or military super-powers with the right economic, political and military systemSweden or Austria will never become a major political, economic or military player, no matter what they do. Scale matters. Nigeria or Pakistan could theoretically become major powers. Source: United Nations, Department of Economic and Social Affairs, Population Division (2011): World Population Prospects, the 2010 Revision. New York
How does Demography shape conflicts? 2 Distribution
Total Population by Major Area, 1950-2100 2 9.1% 21.6% 35.3% 6.7% Source: United Nations, Department of Economic and Social Affairs, Population Division (2011): World Population Prospects, the 2010 Revision. New York
Changes in world population 2 Share of world population (percent) 1950 2100 Europe 21.6% 6.7% Africa 9.1% 35.3%
How does Population Distribution shape conflicts? 1 The global shift of population to Asia and Africa will … • affect military technology: more maritime technology, long-distance capabilities, climate-adjusted capabilities • affect military supply logistics: long-distance transport, difficult terrain, lacking infrastructure • create language barriers: Asia and Africa combined have hundreds of languages • Conflicts are where the people are or where they have their interests Source: United Nations, Department of Economic and Social Affairs, Population Division (2011): World Population Prospects, the 2010 Revision. New York
How does Demography shape conflicts? 3 Concentration
Urban Population Change: 2010 - 2100 3 Source: United Nations, Department of Economic and Social Affairs, Population Division (2012): World Urbanization Prospects, the 2011 Revision. New York
World: Mega-Cities with 10+ Million Inhabitants 3 Population (millions) Number Source: United Nations, Department of Economic and Social Affairs, Population Division (2012): World Urbanization Prospects, the 2011 Revision. New York
How does Population Concentration shape conflicts? 3 The increasing concentration of people in urban areas will… • affect military technology: urban combat, body protection, communication capabilities • Urbanization increases chances of spontaneous protests, lawlessness, violent loitering: people don’t have to go far to join a crowd • Urbanization increases risk of “lonely wolf” attacks: it is probably easier to disappear in a 30-million mega-city • Casualties could be enormous of one single successful attack. • Concentration of the population (and economic assets) in mega-cities increases vulnerability: infrastructure, energy, mobility Source: United Nations, Department of Economic and Social Affairs, Population Division (2011): World Population Prospects, the 2010 Revision. New York
How does Demography shape conflicts? 4 Structure
Total Population by Age Groups, 1950-2100 3 Millions Source: United Nations, Department of Economic and Social Affairs, Population Division (2011): World Population Prospects, the 2010 Revision. New York
Population Age0-14 by Major Area, 1950-2100 3 Millions Source: United Nations, Department of Economic and Social Affairs, Population Division (2011): World Population Prospects, the 2010 Revision. New York
“Most-Active” Population Age 20-34 Years 3 Window of economic opportunity percent of total population Source: United Nations, Department of Economic and Social Affairs, Population Division (2011): World Population Prospects, the 2010 Revision. New York
Population Age 50+ Years 3 percent of total population Population Ageing Source: United Nations, Department of Economic and Social Affairs, Population Division (2011): World Population Prospects, the 2010 Revision. New York
Population Age 0-19 and 50+ Years 3 Age 0-19 Age 50+ The world is ageing! 50+ population will increase from 1.4 to 4 billion Source: United Nations, Department of Economic and Social Affairs, Population Division (2011): World Population Prospects, the 2010 Revision. New York
Economic Impact of Ageing 3 “Unicharm Corp.’s sales of adult diapers in Japan exceeded those for babies for the first time last year.” Yuki Yamaguchi, 9 May, 2012: Elderly at Records Spurs Japan Stores Chase $1.4 Trillion. Bloomberg Businessweek Source: United Nations, Department of Economic and Social Affairs, Population Division (2011): World Population Prospects, the 2010 Revision. New York
How does Population Structure shape conflicts? 3 Population ageing in Europe, America and especially in Asia will … • affect the size and type of military: professional instead of draft army, lack of young men, more women • Older populations will usetechnologyto avoid person to person combat • Hot conflicts will continue to flare up in Africa: very young, ethnically diverse populations Source: United Nations, Department of Economic and Social Affairs, Population Division (2011): World Population Prospects, the 2010 Revision. New York
Population Dynamics, 1950-2050 (based on WPP2006) 3 Source: United Nations, Department of Economic and Social Affairs, Population Division (2011): World Population Prospects, the 2010 Revision. New York
World population by Total Fertility, 1950-2100 3 Population in million Source: United Nations, Department of Economic and Social Affairs, Population Division (2011): World Population Prospects, the 2010 Revision. New York
This PowerPoint presentation was prepared by Gerhard K. Heiligwhile he was Chief of the Population Estimates and Projections Section of the Population Division at the United Nations Department of Economic and Social Affairs (DESA). He retired from the United Nations in February 2013. DisclaimerThis presentation contains tables, figures, maps, and analyses that are based on the 2010 Revision of the United Nations World Population Prospects. However, this presentation does not imply the expression of any opinion whatsoever on the part of the Secretariat of the United Nations concerning substantial results and conclusions, and concerning the legal status of any country, territory, city or area or of its authorities, or concerning the delimitation of its frontiers or boundaries.May 2012 Source: United Nations, Department of Economic and Social Affairs, Population Division (2011): World Population Prospects, the 2010 Revision. New York
Thank You ! www.unpopulation.org Source: United Nations, Department of Economic and Social Affairs, Population Division (2011): World Population Prospects, the 2010 Revision. New York