Download

1 / 17
170 likes | 209 Vues
Explore variogram models for soil properties in BCI plot, fitting polynomial regression and transformation. Maps generated for key elements.

E N D
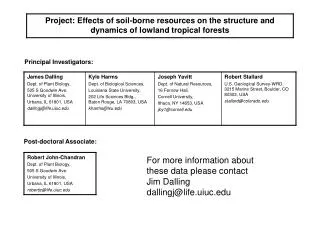
Principal Investigators: Post-doctoral Associate: For more information about these data please contact Jim Dalling dallingj@life.uiuc.edu
Acknowledgements Please acknowledge the following agencies that provided funding for the collection and analyses of these data NSF DEB021104,021115, 0212284,0212818 and OISE 0314581 STRI Soils Initiative and CTFS Thanks to Paolo Segre and Juan Di Trani for assistance in the field
Table 1. Variogram model fit parameters for soil properties for the BCI 50-ha plot. The measured data values were first transformed using Box-Cox transformation, and then a polynomial trend surface regression was fitted. The residuals from the trend surface regression were used to compute empirical variograms, to which variogram models were fitted. Lambda is the Box-Cox parameter, and trend order indicates the order of the polynomial regression. Effective range for the Exponential variogram model is estimated at 3 times the fitted range because the variogram approaches the sill only asymptotically.
Maps: Filled-contour maps plotted using block average data. pH
Maps: Filled-contour maps plotted using block average data. Aluminum (Al): mg / kg of oven-dried soil
Maps: Filled-contour maps plotted using block average data. Boron (B): mg / kg of oven-dried soil
Maps: Filled-contour maps plotted using block average data. Calcium (Ca): mg / kg of oven-dried soil
Maps: Filled-contour maps plotted using block average data. Copper (Cu): mg / kg of oven-dried soil
Maps: Filled-contour maps plotted using block average data. Iron (Fe): mg / kg of oven-dried soil
Maps: Filled-contour maps plotted using block average data. Potassium (K): mg / kg of oven-dried soil
Maps: Filled-contour maps plotted using block average data. Magnesium (Mg): mg / kg of oven-dried soil
Maps: Filled-contour maps plotted using block average data. Manganese (Mn): mg / kg of oven-dried soil
Maps: Filled-contour maps plotted using block average data. Nitrogen (N): mg / kg of oven-dried soil
Maps: Filled-contour maps plotted using block average data. Nitrogen mineralisation: mg / kg of oven-dried soil
Maps: Filled-contour maps plotted using block average data. Phosphorus (P): mg / kg of oven-dried soil
Maps: Filled-contour maps plotted using block average data. Zinc (Zn): mg / kg of oven-dried soil