Download
1 / 14
140 likes | 163 Vues
Understand the fundamentals of formulating and testing research hypotheses in political science, including defining variables, hypotheses examples, and conducting quantitative analysis using datasets. Learn about measures of central tendency, graphic representation of variables, and skewed distributions in research.

E N D
Describing Variables & Hypotheses TestingMay 26, 2008 Ivan Katchanovski, Ph.D. POL 242Y-Y
Research Hypothesis • Hypothesis: A basic statement that is tested in research • Based on a political science theory and previous research • States expected relationship between dependent and independent variables • This relationship can be tested with empirical data • Hypothesis is either supported or not supported by research
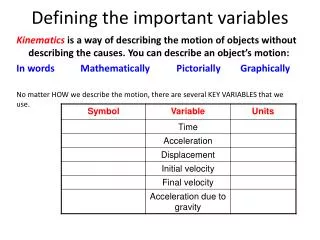
Dependent and independent variables Dependent variable Independent variable A variable which presumed to affect the dependent variable A variable which we use to explain the dependent variable Education level increases personal income The level of economic development has a positive effect on the odds that a country is democratic • A variable assumed to depend on or be affected by the independent variable • A variable which we are interested in explaining • Income level depends on education level • The level of democracy is affected the level of economic development
Examples of Research Hypotheses • People with higher income are more likely to vote for the Conservative Party • Pocket book theory of voting behaviour • Americans are more likely to join civic associations than Canadians are • Political culture theory • Democratic countries do not wage wars with other democratic countries • Democratic peace theory
Exercise Formulate a hypothesis describing relationship between political views and religiosity. Identify the dependent variable and the independent variable.
Outline of Research Paper • Political science theory • previous research • Your research hypothesis • Data • One of datasets from POL 242Y • Research Method
Quantitative Analysis • Univariate - describe a case in terms of a single variable. • Frequency distribution tables and charts • Bivariate - describe a case in terms of two variables simultaneously. • Multivariate - analysis of two or more variables simultaneously.
Frequency distributions Tables or charts that summarize the distribution of a variable Economic development level (World dataset)
Collapsing categories Table 1a. How is the government doing in solving the budget crisis? Table 1b. Evaluation of government performance in solving the budget crisis?
Graphic description of variables Pie chart Bar chart
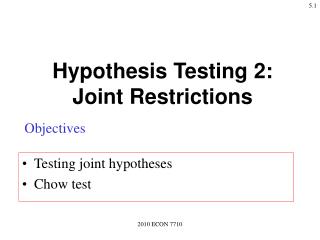
Histogram Figure1. Age distribution of respondents Line chart Graphic description of variables
Measures Of Central Tendency • The Mode: Value that occurs most frequently • useful for nominal variables • The Median: middle value • useful for ordinal and interval-ratio variables • Other Measures of Position: • Percentiles, deciles and quartiles _ • The Mean: average score X=(Xi)/N • useful for interval-ratio variables
Skewed Distributions Skew: The extent to which a distribution of scores has a few scores that are extremely high or extremely low. Positively skewed distribution Unskewed distribution