Historical Changes in Climate
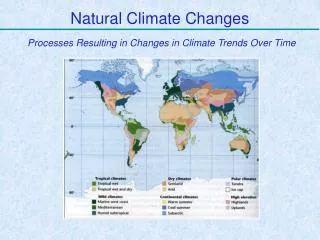
Historical Changes in Climate. Temperature change over last few thousand years Less than 1°C Highly variable from region to region Archives for climate data Mountain glaciers Tree rings Corals Historical observations Instrumental data only during last <1K years General trend

Historical Changes in Climate
E N D
Presentation Transcript
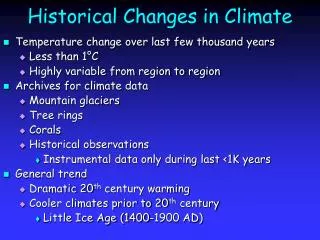
Historical Changes in Climate • Temperature change over last few thousand years • Less than 1°C • Highly variable from region to region • Archives for climate data • Mountain glaciers • Tree rings • Corals • Historical observations • Instrumental data only during last <1K years • General trend • Dramatic 20th century warming • Cooler climates prior to 20th century • Little Ice Age (1400-1900 AD)
Medieval Climatic Optimum • Evidence for relative warmth in high latitude northern hemisphere • Approximately 1000-1300 AD • Nordic people settled southwest Greenland • Fringes of ice sheet • Agricultural evidence for warmth – wheat crops • Little mention of sea ice from this region • Settlements abandoned during Little Ice Age • Suggests marginal environment became inhospitable
Little Ice Age • Cooling during 1400-1900 AD • Well documented in Europe • Colder winters • Failed crops • Shorter growing seasons • Lakes, rivers and ports frozen • Advance of alpine glaciers • Frequency of sea ice along coastal Iceland • Too much ice to fish • Not a true ice age
Ice Growth during Little Ice Age • Evidence for ice growth in Canadian Arctic from lichen halos • Lichens grow on rock surfaces at known rates • Lichen halos interpreted as lichen killed by ice cover • Size of living lichens give time since lichen death • Small size indicates only 100 years of growth
Extent of Ice Growth in Canada • Baffin Island shows large expansion of ice • Ice killed lichens during Little Ice Age • Retreat allowed them to grow only ~100 years ago • Mapping lichen halos gives distribution of ice
Climate Extent & Temperature Trend? • Few observational data and small change • Restrict determining if global or regional cooling • Cooling trend not known • Culmination of slow orbital-scale cooling • Most recent in a series of millennial-scale oscillations
Proxy Measures of Historical Changes • Instrumental records prior to 1900 largely do not exist • Quantitative information is scarce • Problems for archives are several fold • Records must extend from 1900’s back 1000-2000 years • High resolution required high deposition rate • Must be extremely sensitive to detect small changes • Archives • Alpine glacier ice cores • Tree rings • Corals
Alpine Glaciers • Small ice caps on mountains and valley glaciers • Make excellent climate archives • Range from few hundred to thousands of years • Back to LGM • Annual layering at surface • Degrade to decadal resolution at depth
Alpine Glaciers • Drilling is difficult task • Haul equipment to summit • Lack of oxygen • Lack of electricity • Freezing to subfreezing temperatures • Few mountain glaciers drilled
Alpine Glaciers • Multiple ice cores drilled • Through entire thickness of glacier (100-200 m) • Photograph shows drill core extruded • Solar powered drill
Alpine Glaciers • Harsh conditions can prevail • Cores and equipment must be hauled down after drilling • Produce similar records as Greenland and Antarctic ice cores • No mention of gases?
Quelccaya Ice Cap, Peru Remarkably similar to Little Ice Age in Europe Low dust early part of Little Ice Age Medieval Climate Optimum high dust • Peruvian Andes, at ~18,500 feet elevation • From 1980’s show annual-scale d18O and dust changes • More positive d18O and less dust near 1900 • Warmer temperatures and weaker winds • More negative d18O and more dust 1600-1900 • Colder temperatures and stronger winds
Quelccaya Ice Cap, Peru • Little Ice Age showed more negative d18O between 1550 and 1900 AD • Accumulation record more complex • Pronounced wet period before 1700 followed by significantly drier conditions thereafter
Quelccaya Ice Cap, Peru • Return expedition in 1991 • Annual layering at top of core destroyed by meltwater percolation • Previous record indicated 1500 years without melting • Meltwater percolation presumably due to 20th century warming • Rate that was unprecedented compared to last millennium
Dunde Ice Cap, Tibet • Remote region on mountain range separating China's highest desert, the Qaidam Basin, from the Gobi • Snow accumulations for 40,000 years on a 60 km2 ice cap deep in sparsely inhabited interior • US and Chinese expedition in 1987
Dunde Ice Cap, Tibet • Record averaged over 50-year intervals • More positive d18O before 1500 • More negative d18O during Little Ice Age • Transition to more positive d18O at 1700 • Last 50 year interval is more positive than any other year • Core taken to 12,000 year
Ice Core Summary • Climate on low latitude mountains • Colder during the Little Ice Age • Uniquely warmer during the 20th century • Antarctica and Greenland cores • No distinctly cold pattern during Little Ice Age • No unique 20th century warmth • Variation in climate recorded in these archives has been regional
Dendroclimatology • Records from tree rings • Regions where trees are sensitive to climate stress • Near limit of natural range • Climate stress revealed by narrow rings • Century to millennia-length tree-ring chronologies are useful for evaluating • Frequency and magnitude of droughts and wet periods • Placing ecosystem changes into a long-term, historical context of climate change
Stable Isotopes in Dendroclimatology • The d18O of rain varies with changes in temperature and rainout • Rain is absorbed by the growing tree, the d18O of water recorded in the tree rings, and become climate indicators • The d18O of organic material is determined by • The isotopic composition of the source or soil water • Enrichment taking place in the leaf water due to transpiration, resulting in an increased d18O of leaf water compared to d18O of soil water • Biochemical fractionations
Tree Ring Climate Calibration • Tree ring data must be cross-calibrated with instrumental data • Before can used to interpret ancient climate • The character of the relationship between climate and tree growth is assessed • Statistical model is derived to describe that relationship
Arctic Tree Rings • Results synthesized from circumarctic region • Covers middle and end of Little Ice Age • Inferred temperature change of 1°C • Not a time of extreme cold • Warming of the Arctic apparent from mid-20th century • Reaching highest temperatures during 320 year record • But temperatures not significantly higher than 18th century
Tree Ring Studies in Central Asia • Climate on large continent less moderated by oceans • Still, similar to Arctic region • Intervals of warmth during Little Ice Age • Mid-18th century and earlier • Colder temperatures in late 16th, late 17th and mid-to late 19th centuries • Warming in mid- to late 20th century unprecedented
Tree Rings on Tasmania • Records from Huon Pines extend back 2000 years • Best tree ring records of S. hemisphere • Little Ice Age is cooler than late 20th century • Does not stand out as uniquely cold • 20th century warmth stands out in the rate of increase • Temperature matched by earlier times
Tree Ring Summary • Tree ring studies indicate • Climate variable from region to region • Over last several hundred years • No one record fully describes climate trends in all area • Similar to ice cores • Climate varied significantly within the Little Ice Age • In some area even warming to early 20th century levels • Last few decades generally show maximal warmth
Coral and Tropical SST • Decadal resolution SST • Warm tropical environments • Pacific Ocean atolls • Ideal for measuring the occurrence and intensity of El Nino events • Oxygen isotopic and trace elemental compositions yield important climate records
El Nino • Marked by appearance of unusually warm waters in the eastern Pacific in December every 2 to 7 years • Radical alteration of the entire Pacific oceanic and atmospheric system occurs in two phases • In a cool phase, strong SE trade winds push eastern Pacific surface waters westward, allowing cool nutrient-rich bottom waters to upwell
Non-El Nino Years • The western Pacific during cool phases is typified by: • A pool of warm water stretching eastward to 170°W, and an accompanying belt of low pressure and high precipitation • Indonesian Low - covers parts of Asia and Australia • A belt of high precipitation, the ITCZ, lies several degrees north and south of the Equator and east of the Date Line
El Nino • In the warm phase, trade winds weaken and less eastern Pacific surface water is pushed westward • Upwelling in the eastern Pacific slows • Warm waters spread across the Pacific increasing SST by 3-5°C in the Galapagos Islands
El Nino • ITCZ moves S and W, while the Indonesian Low follows the warmer waters east • Barometric pressure in Darwin, Australia rises as higher pressure replaces the Indonesian Low • During particularly severe warm events, winds in the western Pacific reverse and become mild westerlies
Southern Oscillation • El Nino years are times of: • Unusually high pressure and dry conditions over N. Australia • Low pressure and high rainfall in the south-central Pacific • Non-El Nino years are time of • Low pressure and moist conditions over N. Australia • Higher pressure and reduced rainfall in the south-central Pacific • Linking of these two circulation systems in a large-scale flow known as El Nino Southern Oscillation (ENSO)
ENSO • Long-term changes in atmospheric pressure show • Warm El Nino years are time of • Drier conditions and higher pressure in N. Australia • Wetter conditions and lower pressure in south-central Pacific
Atmosphere-Ocean Linkage • Strong east-to-west trades common in non-El Nino years • Pile warm surface water in western Pacific • Warm water is natural source of moisture • Rising moisture off ocean creates low pressure • Creates high precipitation in N. Australia and Indonesia • Rising air cools and flows eastward in the east-central Pacific • Contributes to cooler and dry conditions near S. America
Atmosphere-Ocean Linkage • Trade winds in eastern Pacific weaken in El Nino years • Pool of warm western Pacific water diminished • Water flows eastward • As warm water replaces cool water in central and then eastern Pacific • Becomes the source of moisture and low pressure • As the warm water flow hits western N. America • Flow diverted N and S bring heavy rainfall to California and Peru • Loss of warm water in western Pacific create dryer conditions in Australia and Indonesia
Teleconnections • Unusual oceanic and atmospheric conditions • Tropical regions can affect circulation patterns outside tropics • Flooding in Peruvian Andes and SE US common • Droughts in Indonesian, central India and Australia
Coral Calibration • Calibration of coral d18O with SST measurements • Slight mismatch probably due to salinity • Galapagos corals record low d18O values during warm El Nino years
400 Year Coral SST Record • Little long term trend obvious • Generally more negative values near start and end of record • Perhaps just before 1700 and 1800 • No hint of Little Ice age or 20th century warming • Some Pacific corals show gradual ocean warming and more rainfall towards present
Summary • Despite efforts, coverage of climate over last 1000 years remains incomplete • Synthesis of N. hemisphere temperature change • Show a gradual decline for 900 years • Ending in a dramatic warming in 20th century
Mechanisms Producing Trend • Cooling from 1000 to 1900 AD • Follows orbital cooling pattern • Follows the millennial-scale pattern • Little Ice Age cooler than preceding and following intervals • Began with abrupt cooling
Mechanisms Producing Trend • Most obvious trend between 1000-900 years • Match with gradual orbital cooling
20th Century Warming • Stands out as a unique feature • Rate of warming highest • Temperatures just now rising above uncertainty levels of the reconstruction
20th Century Warning • Reconstruction suggests that 20th century warming • Not simply another in long series of natural climate oscillations • Something unprecedented for the entire millennium
Historical Records of El Nino • Records from ship’s logs date to 1525 AD • SST and sea level • Catch of anchovy and other fish • Sea bird abundance • Heavy rain and floods • Disease (malaria and cholera) • Records ranked qualitatively
Historical Records of El Nino • 115 events in 456 years; event every 8 years • Events cluster • No correlation with Little Ice Age • Record provides a limited glimpse of climate • Local changes are difficult to extrapolate to global scale • El Nino events limited to N. hemisphere winter
Instrumental Temperature Records • Records over last 200-300 years • Air and SST • Limited regions prior to 1900 • Methods limitation on temperature accuracy • Population growth affects local temperature • Change in albedo • Asphalt and vegetation • Can change temperature by as much as 30%
20th Century Global Temperature • Overall trend shows 0.6°C temperature rise • Year to year variability present • Temperature estimates form satellite disagree with thermometer • Abundant observations support significant warming in 20th century
Glaciers • Retreat of alpine glaciers indicates climate warming • Alpine glaciers show varying responses • Due to heterogeneity of climate system • Most glaciers have been in retreat • Rate of melting has accelerated in recent decades • Most plausible explanation is warming of climate
Global Average Sea Level • Difficult nut to crack • Local rebound and tectonic movements • Displacement of groundwater into oceans • Overall agreement of slow rise in sea level • 12-15 cm in last 100 years
Cause of Sea Level Rise • Ice on land has melted adding water to oceans • Water in the oceans has expanded • Surface warming of oceans accounts for about 1/3 of rise • Melting ice remains the most probable explanation for remaining rise