Download
1 / 32
320 likes | 349 Vues
Delve into IPCC climate change assessments, explore emission scenarios, and analyze the impacts of globalized vs. regionalized development on the environment. Understand different future trajectories, including rapid economic growth, technology shifts, and sustainability. Learn about diverse scenarios like A1, A2, B1, B2, and the implications for climate predictions and society. Find out about the SRES scenarios, emissions trajectories, and the implications for addressing global climate challenges.

E N D
Center of Ocean-Land-Atmosphere studies CLIM 101: Weather, Climate and Global Society Observed Climate Changes James Kinter Lecture15: Oct 21, 2008
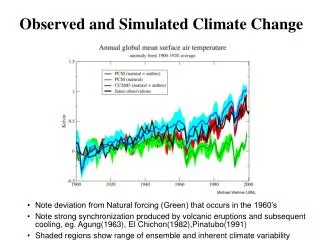
Climate models without volcanic Forcing Domingues et al. 2008
(0-700 m) Climate models withvolcanic Forcing ThSL: Thermosteric sea level change (density changes induced by temperature change)
The IPCC Assessments of ClimateChange and Uncertainties Center of Ocean-Land-Atmosphere studies The Issue of “predictions” The SRES (The Emission Scenarios of the IPCC Special Report on Emission Scenarios) Sarachick, Univ. of Washington
The IPCC Assessments of ClimateChange and Uncertainties Center of Ocean-Land-Atmosphere studies Different scenarios: A1. The A1 storyline and scenario family describes a future world of very rapid economic growth, global population that peaks in mid-century and declines thereafter, and the rapid introduction of new and more efficient technologies. Major underlying themes are convergence among regions, capacity building and increased cultural and social interactions, with a substantial reduction in regional differences in per capita income. The A1 scenario family develops into three groups that describe alternative directions of technological change in the energy system. The three A1 groups are distinguished by their technological emphasis: fossil intensive (A1FI), non-fossil energy sources (A1T), or a balance across all sources (A1B) (where balanced is defined as not relying too heavily on one particular energy source, on the assumption that similar improvement rates apply to all energy supply and end use technologies). A2. The A2 storyline and scenario family describes a very heterogeneous world. The underlying theme is self reliance and preservation of local identities. Fertility patterns across regions converge very slowly, which results in continuously increasing population. Economic development is primarily regionally oriented and per capita economic growth and technological change more fragmented and slower than other storylines. B1. The B1 storyline and scenario family describes a convergent world with the same global population, that peaks in mid-century and declines thereafter, as in the A1 storyline, but with rapid change in economic structures toward a service and information economy, with reductions in material intensity and the introduction of clean and resource efficient technologies. The emphasis is on global solutions to economic, social and environmental sustainability, including improved equity, but without additional climate initiatives. B2. The B2 storyline and scenario family describes a world in which the emphasis is on local solutions to economic, social and environmental sustainability. It is a world with continuously increasing global population, at a rate lower than A2, intermediate levels of economic development, and less rapid and more diverse technological change than in the B1 and A1 storylines. While the scenario is also oriented towards environmental protection and social equity, it focuses on local and regional levels.
The IPCC Assessments of ClimateChange and Uncertainties Center of Ocean-Land-Atmosphere studies The Issue of “predictions” An illustrative scenario was chosen for each of the six scenario groups A1B, A1FI, A1T, A2, B1 and B2. All should be considered equally sound. The SRES scenarios do not include additional climate initiatives, which means that no scenarios are included that explicitly assume implementation of the United Nations Framework Convention on Climate Change or the emissions targets of the Kyoto Protocol. Sarachick, Univ. of Washington
Center of Ocean-Land-Atmosphere studies IPCC SRES Emission Scenarios(The Emission Scenarios of the IPCC special Report on Emission Scenarios) Pg (Petagram) =1015 g = Gt (Gigaton)
The IPCC Assessments of ClimateChange and Uncertainties Center of Ocean-Land-Atmosphere studies The six IPCC scenarios arespline fits to projections (initialized with observations for 1990) of possiblefuture emissions for four scenario families, A1, A2, B1, and B2, which emphasizeglobalized vs. regionalized development on the A,B axis and economicgrowth vs. environmental stewardship on the 1,2 axis. Three variants of the A1(globalized, economically oriented) scenario lead to different emissions trajectories:A1FI (intensive dependence on fossil fuels), A1T (alternative technologieslargely replace fossil fuels), and A1B (balanced energy supply betweenfossil fuels and alternatives). A1 Scenarios – Fast economic growth and globalization These describe a future world of very rapid economic growth, global population that peaks in mid-century and declines thereafter, and the rapid introduction of new and more efficient technologies.There are increasing levels of international cultural and social interactions and regional differences in income are substantially reduced.There are three types of A1 scenarios that describe different directions of technological change in the energy industry: A1F1 is fossil fuel intensive, A1T puts a greater emphasis on non-fossil energy sources, while societies in A1B use a variety of energy sources. A1B also assumes that technologies to exploit all energy sources will advance at similar rates. A2 Scenarios – Rising population and slower technical innovation These describe a very heterogeneous world. In this scenario, countries and regions seek to achieve self-reliance and to preserve their local identities.The birth rates in different regions become more and more similar, which results in continuously increasing population. Economic development is primarily regionally oriented. Per capita economic growth and technological change are more fragmented and slower than for other scenarios. B1 Scenarios – Service economy and global solutions These have the same global population growth as the A1 scenarios. But its economic structures evolve rapidly towards a service and information economy. Material resources are less exploited and clean and resource-efficient technologies are introduced.The emphasis is on global solutions to economic, social and environmental sustainability, but without additional climate initiatives. B2 Scenarios These describe a world in which the emphasis is on local solutions to economic, social and environmental sustainability. It is a world with continuously growing population (but at a slower rate than the A2 scenarios). The rate of economic development is neither breakneck nor stalling.Technological change is less rapid but more diverse than in the A1 and B1 scenarios. While the scenarios are also oriented towards environmental protection and social equity, they focus on local and regional levels.
Projected Future Warming Center of Ocean-Land-Atmosphere studies Figure 9.13, IPCC TAR
WRE Stabilization Scenarios and Permissible Emissions Center of Ocean-Land-Atmosphere studies WRE: Wigley, Richels, and Edmonds (WRE 1996) used in IPCC TAR Figure 10.22, IPCC AR4
WRE 500 Permissible Emissions and “THE GAP” Center of Ocean-Land-Atmosphere studies
Center of Ocean-Land-Atmosphere studies THANK YOU! ANY QUESTIONS?