Download
1 / 43
440 likes | 549 Vues
Explore observed environmental changes affecting climate, such as fossil fuel combustion, greenhouse gases, heat generation, & more. Learn about global warming, heat waves, sea level rise, and the control of heat through various mechanisms. Witness the evidence of climate change in glaciers melting, changes in sea ice, and precipitation patterns. Discover how human activities are influencing our planet's climate and explore potential solutions to combat these changes.

E N D
Some human-induced environmental changes relevant to climate • Changes in land use (e.g. farming, building cities) • Storage and use of water (dams, reservoirs, irrigation) • Combustion of fossil fuels • Generation of heat • Generation of particulate pollution (e.g., soot, smoke) • Generation of gaseous pollution particulates (e.g., sulfur dioxide, nitrogen dioxide; get oxidized to form sulfate, nitrate) • Generates carbon dioxide • Generation of other greenhouse gases Methane, Nitrous oxide, Chlorofluorocarbons, Ozone Especially via biomass burning, landfills, rice paddies agriculture, animal husbandry, fossil fuel use, leaky fuel lines, and industry Changes the composition of the atmosphere Most important are the gases with long lifetimes Like CO2 > 100 years
The incoming energy from the sun is 342 W m-2: but this is the annual global mean: It amounts to 175 PetaWatts =175,000,000 billion Watts. About 120 PW is absorbed. The biggest power plants in existence are 1000 MegaWatts and we normally think of units of 1 KiloWatt = 1 bar heater; or 100 W = light bulb. • So the energy from the sun is 120 million of these power stations. It shows: • Direct human influences are tiny vs nature. • The main way human activities can affect climate is through interference with the natural flows of energy such as by changing the composition of the atmosphere
The enhanced greenhouse effect • CO2 has increased >33% • If CO2 were suddenly doubled then: • atmosphere must warm up to restore balance • via radiation to space • In absence of other changes: warming is 1.2°C • Feedbacks cause complications • Best estimate is warming of 2.9°C • so feedbacks roughly double change • Real world changes complex and • more gradual
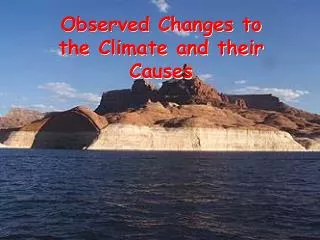
Climate The atmosphere is a “global commons.” Air over one place is typically half way round the world a week later, as shown by manned balloon flights. The atmosphere is a dumping ground for all nations for pollution of all sorts. Some lasts a long time and is shared with all. One consequence is global warming!
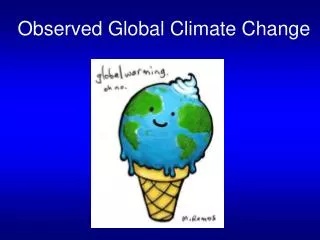
Global Warming is happening Since 1970, rise in:Decrease in: • Carbon Dioxide Snow extent • Global temperatures Arctic sea ice • Global SSTs • Global sea level • Tropical SSTs • Water vapor • Rainfall intensity • Precipitation extratropics • Hurricane intensity • Drought
Nonlinear fit Overall warming 0.75ºC Up 0.55ºC since 1970 Variations of the Earth’s surface temperature Annual mean departures from the 1961-90 average for global temperatures, mean 14.0°C, and carbon dioxide concentrations from ice cores and Mauna Loa (1958 on), mean 333.7 ppmv. Updated from Karl and Trenberth 2003.
Heat Waves Impacts on human health and mortality, economic impacts, ecosystem and wildlife impacts
Extremes of temperature are changing! Observed trends (days) per decade for 1951 to 2003 From Alexander et al. (2006)
Europe summer temperatures Exceptional heat wave and drought of 2003 was a major extreme made more likely by global warming: 30K deaths From P. Jones
Sea level is rising: from ocean expansion and melting glaciers • Since 1993 • Global sea level • has risen 37 mm • (1.46 inches) • 60% from • expansion as ocean temperatures rise, • 40% from melting glaciers • Steve Nerem
Controlling Heat Human body: sweats Homes: Evaporative coolers (swamp coolers) Planet Earth: Evaporation (if moisture available) e.g., When sun comes out after showers, the first thing that happens is that the puddles dry up: before temperature increases.
Water Holding Capacity A basic physical law tells us that the water holding capacity of the atmosphere goes up at about 7% per degree Celsius increase in temperature. Observations show that this is happening at the surface and in lower atmosphere: This means more moisture available for storms.
Total column water vapor is increasing: Best estimate of linear trends for global ocean 1.3±0.3% per decade Sig. at >99% Trenberth et al 2005
Global warming Heating Temperature & Evaporation water holding capacity atmospheric moisture greenhouse effect & rain intensity Floods & Droughts
Regions where recent decades heavy precip >> mean precip updated from Groisman et al. (2005a). Precipitation Observed trends (%) per decade for 1951–2003 contribution to total annual from very wet days>95th %ile. Alexander et al 2006
Evidence for reality of climate change Glaciers melting 1909 Toboggan Glacier Alaska 2000 1858 1974 Grindelwald Glacier Switzerland 1900 2003 Alpine glacier, Austria
Declines in sea ice and snow cover Runoff from earlier snow melt about 1-2 weeks earlier
Surface melt on Greenland Melt descending into a moulin: a vertical shaft carrying water to the base of the ice sheet. Braithwaite Univ. Manchester
SNOW PACK: In many land and mountain areas, global warming contributes to: • more precipitation falls as rain rather than snow, especially in the fall and spring. • snow melt occurs faster and sooner in the spring • snow pack is therefore less as summer arrives • soil moisture is less, and recycling is less • global warmingmeans moredrying and heat stress • the risk of drought increases substantially in summer • along with heat waves and wildfires Wildfire, near Denver CO: 2002
Drought: • 3 kinds of drought • Meteorological:absence of rain • Agricultural:absence of soil moisture • Hydrological:absence of water in rivers, lakes and reservoirs
Palmer Drought Severity Index PDSI Dominant pattern: Upward trend. Dai et al 2004 Dry Wet
Rising greenhouse gases are causing climate change and arid areas are becoming drier while wet areas are becoming wetter. Water management:- dealing with how to save in times of excess for times of drought – will be a major challenge in the future.
Context: 400,000 years of Antarctic ice core records of Temperatures, Carbon Dioxide and Methane. Last ice age glacial: 20,000 years ago Source: Hansen, Climatic Change 2005, based on Petit, Nature 1999
CO2 Temp.
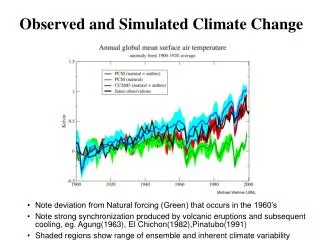
Natural forcings do not account for observed 20th century warming after 1970 Meehl et al, 2004: J. Climate.
Climate change & other environmental issues are inter-linked
Energy Food Biodiversity Water
Agricultural Lands Coastal Zones Forest Lands Freshwater Systems Arid Lands Grasslands Food and Fiber Production Provision of Clean and Sufficient Water Maintenance of Biodiversity Maintenance of Human Health Storage and cycling of Carbon, Nitrogen, Phosphorus Climate change will affect the ability of ecological systems to provide essential ecological goods and services
Food production needs to double to meet the needs of an additional 3 billion people in the next 30 years Climate change is projected to decrease agricultural productivity in the tropics and sub-tropics
Wood fuel is the only source of fuel for one third of the world’s population Wood demand will double in next 50 years Climate change is projected to increase forest productivity, but forest management will become more difficult, due to an increase in pests and fires
Climate change is projected to decrease water availability in many arid and semi-arid regions Water Services One third of the world’s population is now subject to water scarcity The population facing water scarcity will more than double over the next 30 years
Estimated 10-15% of the world’s species could become extinct over the next 30 years Biodiversity underlies all ecological goods and services Climate change will exacerbate the loss of biodiversity
The Challenge: Sustainable Management of an Ever-Changing Planet
Global warming actions There are uncertainties about how climate will change. But climate will change. And it could be very disruptive. There will be substantial costs incurred; -often by innocent people and countries • The issue is directly linked to • fossil fuel energy use. • security (foreign oil imports). • sustainability. Oil supplies will be exceeded by demand sooner or later and long before we run out.
The challenge is to better determine the heat budget at the surface of the Earth on a continuing basis: Provides for changes in heat storage of oceans, glacier and ice sheet melt, changes in SSTs and associated changes in atmospheric circulation, some aspects of which should be predictable on decadal time scales. We need a better observing system!
The parable of the frog A frog placed in a pot of hot water, immediately jumps out to save himself. But a frog placed in a pot of cold water that is slowly brought to the boil, remains in the pot and dies! Is this a parable for global warming?