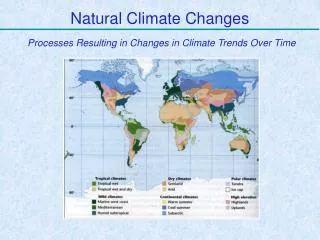
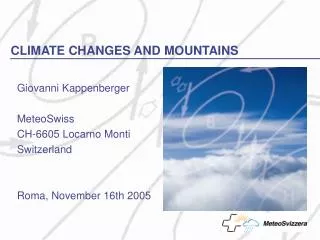
CLIMATE CHANGES AND MOUNTAINS
CLIMATE CHANGES AND MOUNTAINS. Giovanni Kappenberger MeteoSwiss CH-6605 Locarno Monti Switzerland Roma, November 16th 2005. CLIMATE CHANGES AND MOUNTAINS. Glaciers: Indicators of climatic changes 1. ARCTIC 2. ALPS 3. HIMALAYA. Paradies Glacier and Adula GR/TI-Switzerland,

CLIMATE CHANGES AND MOUNTAINS
E N D
Presentation Transcript
CLIMATE CHANGES AND MOUNTAINS Giovanni Kappenberger MeteoSwiss CH-6605 Locarno Monti Switzerland Roma, November 16th 2005
CLIMATE CHANGES AND MOUNTAINS Glaciers: Indicators of climatic changes 1. ARCTIC 2. ALPS 3. HIMALAYA Paradies Glacier and Adula GR/TI-Switzerland, 1930 A.Gansser and 2001 G.Kappenberger
1. ARCTICCoburg Island and Pond Inlet, CA 1975 next picture 1975
Coburg Island, North Water, CDN Coburg Island Laika Ice cap LANDSAT
Laika Glacier 2005, and 1971 Earth-google, 2005 Laika Glacier under a thin Ac layer
Laika Glacier 2005 and before, in 1971 Coast line Earth-google, 2005
Pond Inlet, summer precipitation Mising coloumn = missing data
2. ALPSBasodino glacier, mass balance palina 1 fascia 2 3 4 5
Basodino glacier, mass balance 1992-2005 -3 m water eq. Cumulated mass balance winter (blue) summer (red) and yearly mass balance
Athmospheric summer warming over Milan In half a century the 5 summer months, May to September, show an increasing sum of positive temperature values at 700 hPa from about 300 to 450 degrees. This correspondsto 30 degrees a month, or one degree a day. - Climbing of zero degree line: 150 to 200 m
Time-hight section of relative decadal Swiss snow day trends in %/year SNOW TREND Blue: positive trends, red: negative trends. Filled circles with black border show a significant trend. Scherrer 2004 www.meteoswiss.ch
Loss of snow and glaciers, what can we do? Andermatt Verbier
Flood in the Alps in August 2005 Engadina Bassa, GR Heavy precipitation hit the northen Swiss Alps, 21-23 August 2005. • During the „multi-secular event“ • rain fell up to 3400 m and found • a lot of debris in the mountains, due to: • glacial retreat • ice exposure • retreating permafrost Brienz, BE
Permafrost in the Swiss Alps - PERMOS Temperature evolution of permafrost Murtel-Corvatch, 11.5 m deep, 15 years of data C.Roth.
Changes: Flowering of “anemone bianca” Wood anemone Anemone nemorosa L. march
Change in the alpine Flora On 10 summits of the Bernina region GR, Swiss Alps Uni Zürich and Hannover, October 2005 (AP) 3262 m 2959 m Ca. 1930 1980 2005 - More then a doubling of the number of species - Acceleration of the increasing amount of species
Climbing vegetation ! Treeline –Onsernone: 2000m. Forest limit
Climbing vegetation ! Climbing trees ! Summer 2005: in the Onsernone TI/CH Larix decidua was found at 2300 m Treeline: 2000 m. Forest limit
Change of animals behavior! Marmot travels up the Basodino glacier, on May 18th 2005, during 2 h, from 2400 to 3150 m
3. HIMALAYA NOAA, Everest 28.01.2004
Accumulation; yearly layers Gangchenpo,
Yala glacier, 5200 m, 1991 and 1992 Sampel site and results
1991 1992 Langtang, Lirung Glacier and Yala Glacier Y Samples 1992 L Ky L: Lirung and Y: Yala Glacier. Ky: Kyangjing
1991-1992 Langtang-Lirung Glacier, surface lowering 1991-92 Reference: Intersection of near moraine and far mountain. Lowering of glacier surface about 5 m in one year Picture of 1992, with references to 91
Langtang, Kyangjing 3900 m DHM weather station Kyangiing Glaciological work
Temperature evolution in Nepal (DHM) Shresta, 1999
The atmosphere in summer on the southern side of the Himalaya : http://weather.uwyo.edu/upperair/sounding.html
Warming of the atmosphere in summer on the southern side of the Himalaya Each point is the monthly mean of the zero degree hight of the New Delhi 00 utc sounding
Radiosond and atmospheric warming • In 30 years the zero degree line climbed in summer about 100 to 200 m, in June more than 300 m • Difficulties in evaluating possible sistematic error, • (resulting slope could be larger)
Changes in the circulation? in the convection? Possible changes in the dinamic of local winds and convective clouds. Langtang region. Kappenberger et al 1993
A recent extreme event? Big avalanche on Mt. Kangru, 20 October 2005 K: Mt. Kangru POK: Pokhara B: Bhairahawa K B
The storm of 20th Oct. 2005: was it an extrem one? K P B K: Mt. Kangru P: Pokhara B: Bhairahawa
Extreme precipitation events on high mountains ??? Was the recent avalanche accident in the Annapurna region of Nepal (20th Oct. 05) a consequence of an exeptional storm ??? Avalanche at Tilicho Peak. 29th Oct. 1980 Same region, exactly 25 y earlier
Tilicho Peak, 7132 m, Annapurna region Ice avalanche: Picture sequence: 1. from the side By G.Kappenberger And 2. From the front By M.Braud 1 2
Manaslu, center and Pisang P. left. Mt. Kangru to the left