Recent Observations of Climate Change: What Are We Noticing?
This article explores the recently observed changes in our environment, focusing on topics such as climate patterns, vegetation cover, sea-level rise, and extreme weather events. It poses critical questions regarding the nature of these changes—are they due to natural variability or anthropogenic climate change? Through comparisons of global mean sea level trends and studies on storm frequencies, the article emphasizes the complexities and uncertainties surrounding climate change and encourages readers to navigate the myriad of information available to discern facts from speculation.


Recent Observations of Climate Change: What Are We Noticing?
E N D
Presentation Transcript
RECENTLY OBSERVED CHANGES L. DE WET
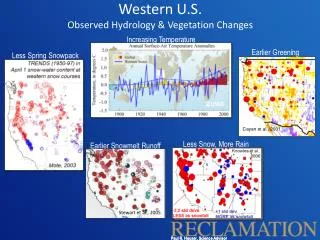
INTRODUCTION • If we ask ourselves: ARE there any recently observed changes, what would our answer be? • And then, WHAT changes are we talking about? • Is it changes in • the climate? • vegetation? • sea-level rise? • temperature and rainfall? What exactly do we need to find out? • If we had to take a guess (not very scientific) we would say there are changes that we can see (or feel that) have taken place, for example, a perceived (?) increase in floods, fires, vegetation cover, distances from the sea, etc. • Is there an increase or is it just an increase in the communication technology? • Are there changes in the average temperatures and precipitation? • Are the changes due to natural variability or are they due to climate change? • Where do extreme events fit in? • We could surf the internet and find a mass of information confronting us from all sides, but what can we believe and what must we watch out for?
INTRODUCTION Figure 1 Schematic representation of the two main schools of thought on Climate Change.
INTRODUCTION • Sea-level rises • There are many topics to choose from, such as: • Vegetation cover • Diseases • Ecosystems, etc.
Figure 1 shows the evolution of global mean sea level in the past and as projected for the 21st century for the SRES A1B scenario. • FAQ 5.1, Figure 1. Time series of global mean sea level (deviation from the 1980-1999 mean) in the past and as projected for the future. For the period before 1870, global measurements of sea level are not available. The grey shading shows the uncertainty in the estimated long-term rate of sea level change (Section 6.4.3). The red line is a reconstruction of global mean sea level from tide gauges (Section 5.5.2.1), and the red shading denotes the range of variations from a smooth curve. The green line shows global mean sea level observed from satellite altimetry. The blue shading represents the range of model projections for the SRES A1B scenario for the 21st century, relative to the 1980 to 1999 mean, and has been calculated independently from the observations. Beyond 2100, the projections are increasingly dependent on the emissions scenario (see Chapter 10 for a discussion of sea level rise projections for other scenarios considered in this report). Over many centuries or millennia, sea level could rise by several metres (Section 10.7.4).
Sea level rise – update 2012 update on sea-level rise • http://www.bbc.co.uk/news/science-environment-19702450
http://www.skepticalscience.com/news.php?p=2&t=51&&n=349 Friday, 3 September, 2010 Hurricanes And Climate Change: Boy Is This Science Not Settled! • The current research into the effects of climate change on tropical storms demonstrates not only the virtues and transparency of the scientific method at work, but rebuts the frequent suggestion that scientists fit their findings to a pre-determined agenda in support of climate change. In the case of storm frequency, there is no consensus and reputable scientists have two diametrically opposed theories about increasing frequencies of such events. • The background to these enquiries stems from a simple observation: extra heat in the air or the oceans is a form of energy, and storms are driven by such energy. What we do not know is whether 1) we might see more storms as a result of extra energy or, as other researchers believe, 2) the storms may grow more intense, but the number might actually diminish. • What do the records show? According to the Pew Centre, “Globally, there is an average of about 90 tropical storms a year”. The IPCC AR4 report (2007) says regarding global tropical storms: "There is no clear trend in the annual numbers [i.e. frequency] of tropical cyclones."
But this graph, also from the Pew Centre, shows a 40% increase in North Atlantic tropical storms over the historic maximum of the mid-1950, which at the time was considered extreme: • But while the numbers are not contested, their significance most certainly is. Another study considered how this information was being collected, and research suggested that the increase in reported storms was due to improved monitoring rather than more storms actually taking place. • And to cap it off, two recent peer-reviewed studies completely contradict each other. One paper predicts considerably more storms due to global warming. Another paper suggests the exact opposite – that there will be fewer storms in the future. • What can we conclude from these studies? About hurricane frequency – not much; the jury is out, as they say. About climate change, we can say that these differing approaches are the very stuff of good science, and the science clearly isn’t settled! It is also obvious that researchers are not shying away from refuting associations with climate change, so we can assume they don’t think their funding or salaries are jeopardised by research they believe fails to support the case for AGW. The scientific method is alive and well.
Table 1: Comparison of the TREES map (true kt, 1992) and the updated land cover map (estimatedke, 1998). All values in % of the total nr. of pixels (4,136,571). 88.9% of the pixels are correctlyclassified or unchanged (ke=kt), 11.1% are misclassified or changed (ke≠ kt)
The 2007 Arctic sea ice minimum, on September 16, 2007, reached the lowest ice extent in the satellite record.—Credit: National Snow and Ice Data Center
Arctic sea ice extent for March, 2009, was 15.16 million square kilometers (5.85 million square miles). The magenta line shows the 1979 to 2000 median extent for that month. The black cross indicates the geographic North Pole. Sea Ice Index data. About the data. —Credit: National Snow and Ice Data Center
http://ocean.dmi.dk/arctic/plots/icecover/icecover_2010.png Sea ice extent for the past 5 years (in million km2) for the northern hemisphere, as a function of date.
SUNSPOT ACTIVITY • Main reference: Alexander, W.R.J., 2008. The likelihood of a Global drought 2009-2016. • Earth’s climate is driven by the sun. • Changes in the climate should therefore be mainly attributed to changes in solar activity. • The IPCC uses Global surface temperature data from 1850 to substantiate climate change.
SUNSPOT ACTIVITY • Alexander obtained this data set + sunspot data and plotted the temperature as in Figure 1.
SUNSPOT ACTIVITY • Figure 1 is correct but used by IPCC to justify anthropogenic global warming associated with increase in GGEs. • According to Figure 1 however, there is no sustained increase in Ta since 1998. • IPCC did not take the next step and attempt to eliminate the solar influence (natural variability) before it lay the blame on human activity. • A simple Excel analysis was done to relate the solar activity and Ta.
SUNSPOT ACTIVITY • In such an analysis it is common to split the data record and so 1913 is a convenient place to do this because it is start of Double Sunspot Cycle. Results showed: 1913-2006: Increasing sunspot numbers and Ta. 1850-1912:Decreasing sunspot numbers and Ta.
SUNSPOT ACTIVITY • This proves that there is a cyclic correlation between Ta and sunspot activity. • It has also been known for 100 years in S.A. that there is a synchronous correlation between solar activity, rainfall and river flow. • Alternating sunspot cycles are also related to acceleration and deceleration of the sun as it moves through space. • Results using annual time scales differ from results using the synchronous sunspot cycles.
SUNSPOT ACTIVITY • So which time scale to use? • Answer: double sunspot cycle length (21 years). • Table 1: 1843 – 1866 (24 y) • 1867 – 1888 (22 y), etc. • The sunspot minima associated with the double sunspot cycle are then 1843, 1866, etc.
SUNSPOT ACTIVITY • Table 3 shows periods of years linked to wet- and dry periods (NOT annual linked to the climate). • This, according to Alexander, 2008 is very NB point and changes the results of analyses by scientists. • To construct Table 4 according to method by Alexander is therefore simple.
SUNSPOT ACTIVITY • Table 4: left-hand column – years in which double sunspot activity starts • And top row: period year numbers. • Grouping of wet- and dry sequences and the correlation with double sunspot activity is very clear. • Compare with Figure 2: Dominance of wet years associated with first sunspot cycle (years 1-11) and • Drys years associated with the second sunspot cycle (years 12-22).
SUNSPOT ACTIVITY • This type of cycle can be used to predict the next cycle. • NB – the periodicity (and not the sunspot cyclicity) is used as the prediction tool. • Figure 3 – river flow prediction model. • Average runoff amounts were calculated according to the method described and plotted from 1995. • Note the well-above average river flows for year 13 (2008) and
SUNSPOT ACTIVITY • the below-average river flow from period 14 onwards. • This prediction model has been tested and verified. • This means that a period of drought is going to ensue from 2009 onwards. • [Remember the high rainfall in 2009 could be classified as an extreme event and can be part of a drought scenario]. • The sunspot minimum was recorded in Jan 2008. This means that a lack of sunspot activity is taking place and could lead to global cooling (associated with dry period).