Download
1 / 12
120 likes | 451 Vues
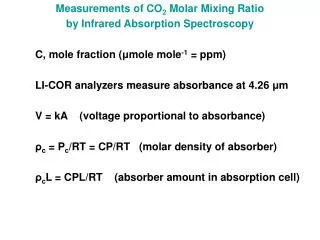
Measurements of CO 2 Molar Mixing Ratio by Infrared Absorption Spectroscopy C, mole fraction ( μ mole mole -1 = ppm) LI-COR analyzers measure absorbance at 4.26 μ m V = kA (voltage proportional to absorbance) ρ c = P c /RT = CP/RT (molar density of absorber)

E N D
Measurements of CO2 Molar Mixing Ratio by Infrared Absorption Spectroscopy C, mole fraction (μmole mole-1 = ppm) LI-COR analyzers measure absorbance at 4.26 μm V = kA (voltage proportional to absorbance) ρc = Pc/RT = CP/RT (molar density of absorber) ρcL = CPL/RT (absorber amount in absorption cell)
Virial Equation of State (REAL not IDEAL): PV = nRT(1 + nB(T)/V + nC(T)/V2 + …) neglect higher order terms Solve for n: n = -(V/2B){1 – (1 + 4PB/RT)1/2} B (10-6 m3 mole-1) (in air at T = 300 K) air -7.7 CO2 -42.3 Using this, we find the equivalence of (at 300 K and 1 Bar): volume mixing ratio 370.0 x 10⁻⁶ m3 CO2 / m3 air molar mixing ratio 370.5 x 10⁻⁶ mole CO2 / mole air
LiCor Analyzer Response Curve: C = [a0 + a1 (V P0/P) + a2 (V P0/P)2] T/T0 C is CO2 mole fraction P0, T0 are pressure and temperature during calibration
Pressure Broadening effective pressure: Pe = PN2 + Σbi Pi Gas Coef (bi) % of air N2 1.00 78.084 O2 0.81 20.946 Ar 0.78 0.934 H2O ≈1.57 ≈1
Pressure Broadening Example calibration curve in air (PO2 = 20 kPA, PN2 = 80 kPA): Pe = 80 kPa x 1.00 + 20 kPa x 0.81 = 96.2 kPa C = 326.61 + 0.1738 V + 4.5095 x 10⁻⁵ V2 A LiCor response of 300 mV implies CO2 = 382.82 ppm What if you calibrated using pure N2? (PN2 = Pe = 100 kPa) C = 326.61 + 0.1807 V + 4.8723 x 10⁻⁵ V2 Now a response of 300 mV gives CO2 = 385.21 ppm ! What error is made using synthetic (no Argon) vs. real air?
Water Vapor • Pressure broadening of CO2 line bH2O≈ 1.57 • Dilution of air – adding 1% H2O displaces 1% of CO2 (≈ 3.7 ppm) Solution: DRY THE AIR! How dry is dry enough? 0.1 ppm / 370 ppm = 0.027% → H2O ≤ 0.00027 m3/m3 air Error in CO2Dewpoint 0.1 ppm -36.5oC 0.2 ppm -29.4oC
The results differ for different LiCor CO2 analyzers under the same conditions!!!