Rotational and Vibrational Spectroscopy
1.11k likes | 3.69k Vues
Rotational and Vibrational Spectroscopy. Lecture Date: January 30 th , 2008. Vibrational and Rotational Spectroscopy. Core techniques: Infrared (IR) spectroscopy Raman spectroscopy Microwave spectroscopy. The Electromagnetic Spectrum. The basic!. Microwave Infrared (IR).

Rotational and Vibrational Spectroscopy
E N D
Presentation Transcript
Rotational and VibrationalSpectroscopy Lecture Date: January 30th, 2008
Vibrational and Rotational Spectroscopy • Core techniques: • Infrared (IR) spectroscopy • Raman spectroscopy • Microwave spectroscopy
The Electromagnetic Spectrum • The basic! • Microwave • Infrared (IR)
The History of Infrared and Raman Spectroscopy • Infrared (IR) Spectroscopy: • First real IR spectra measured by Abney and Festing in 1880’s • Technique made into a routine analytical method between 1903-1940 (especially by Coblentz at the US NBS) • IR spectroscopy through most of the 20th century is done with dispersive (grating) instruments, i.e. monochromators • Fourier Transform (FT) IR instruments become common in the 1980’s, led to a great increase in sensitivity and resolution • Raman Spectroscopy: • In 1928, C. V. Raman discovers that small changes occur the frequency of a small portion of the light scattered by molecules. The changes reflect the vibrational properties of the molecule • In the 1970’s, lasers made Raman much more practical. Near-IR lasers (1990’s) allowed for avoidance of fluorescence in many samples. W. Abney, E. R. Festing, Phil. Trans. Roy. Soc. London,1882,172, 887-918.
Infrared Spectral Regions • IR regions are traditionally sub-divided as follows: After Table 16-1 of Skoog, et al. (Chapter 16)
What is a Wavenumber? • Wavenumbers (denoted cm-1) are a measure of frequency • For an easy way to remember, think “waves per centimeter” • Relationship of wavenumbers to the usual frequency and wavelength scales: • Converting wavelength () to wavenumbers: Image from www.asu.edu
Rotational and Vibrational Spectroscopy: Theory • Overview: • Separation of vibrational and rotational contributions to energy is commonplace and is acceptable • Separation of electronic and rovibrational interactions • Basic theoretical approaches: • Harmonic oscillator for vibration • Rigid rotor for rotation • Terminology: • Reduced mass (a.k.a. effective mass): See E. B. Wilson, Jr., J. C. Decius, and P. C. Cross, “Molecular Vibrations”, Dover, 1955.
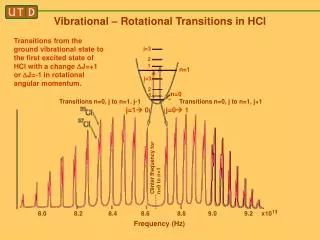
Rotational Spectroscopy: Theory • Rotational energy levels can be described as follows: For J = 0, 1, 2, 3… The rotational constant: The centrifugal distortion coefficient: Where: c is the speed of light k is the Hooke’s law force constant r0 is the vibrationally-averaged bond length is the reduced mass h is Planck’s constant Example for HCl: B0 = 10.4398 cm-1 D0 = 0.0005319 cm-1 r0 = 1.2887 Å 0 = 2990.946 cm-1 (from IR) k = 5.12436 x 10⁵ dyne/cm-1 R. Woods and G. Henderson, “FTIR Rotational Spectroscopy”, J. Chem. Educ., 64, 921-924 (1987)
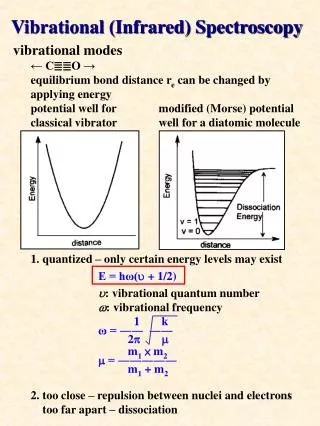
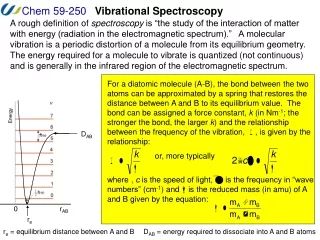
Vibrational Spectroscopy: Theory • Harmonic oscillator – based on the classical “spring” m is the natural frequency of the oscillator (a.k.a. the fundamental vibrational wavenumber) k is the Hooke’s law force constant (now for the chemical bond) Note – all E are potential energies (V)! v is the vibrational quantum number h is Planck’s constant • Since v must be a whole number (see Ex. 16-1, pg. 386): and (wavenumbers) • The potential energy function is: or r is the distance (bond distance) re is the equilibrium distance
Vibrational Spectroscopy: Theory • Potential energy of a harmonic oscillator: Figure from Skoog et al.
Anharmonic Corrections • Anharmonic motion: when the restoring force is not proportional to the displacement. • More accurately given by the Morse potential function than by the harmonic oscillator equation. • Primarily caused by Coulombic (electrostatic) repulsion as atoms approach • Effects: at higher quantum numbers, E gets smaller, and the ( = +/-1)selection rule can be broken • Double ( = +/-2), triple ( = +/-3), and higher order transitions can occur, leading to overtone bands at higher frequencies (NIR) Deis the dissociation energy
Vibrational Coupling • Vibrations in a molecule may couple – changing each other’s frequency. • In stretching vibrations, the strongest coupling occurs between vibrational groups sharing an atom • In bending vibrations, the strongest coupling occurs between groups sharing a common bond • Coupling between stretching and bending modes can occur when the stretching bond is part of the bending atom sequence. • Interactions are strongest when the vibrations have similar frequencies (energies) • Strong coupling can only occur between vibrations with the same symmetry (i.e. between two carbonyl vibrations)
Vibrational Modes and IR Absorption • Number of modes: • Linear: 3n – 5 modes • Non-linear: 3n – 6 modes • Types of vibrations: • Stretching • Bending • Examples: • CO2 has 3 x 3 – 5 = 4 normal modes Symmetric No change in dipole IR-inactive Asymmetric Change in dipole IR-active Scissoring Change in dipole IR-active • IR-active modes require dipole changes during rotations and vibrations!
Vibrational Modes: Examples • IR-activity requires dipole changes during vibrations! • For example, this is Problem 16-3 from Skoog: Inactive Active Active Active Inactive Active Inactive
IR Spectra: Formaldehyde • Certain types of vibrations have distinct IR frequencies – hence the chemical usefulness of the spectra • The gas-phase IR spectrum of formaldehyde: (wavenumbers, cm-1) • Tables and simulation results can help assign the vibrations! Formaldehyde spectrum from: http://www.cem.msu.edu/~reusch/VirtualText/Spectrpy/InfraRed/infrared.htm#ir2 Results generated using B3LYP//6-31G(d) in Gaussian 03W.
Rayleigh and Raman Scattering • Only objects whose dimension is ~1-1.5 will scatter EM radiation. • Rayleigh scattering: • occurs when incident EM radiation induces an oscillating dipole in a molecule, which is re-radiated at the same frequency • Raman scattering: • occurs when monochromatic light is scattered by a molecule, and the scattered light has been weakly modulated by the characteristic frequencies of the molecule • Raman spectroscopy measures the difference between the wavelengths of the incident radiation and the scattered radiation.
The Raman Effect • The incident radiation excites “virtual states” (distorted or polarized states) that persist for the short timescale of the scattering process. • Polarization changes are necessary to form the virtual state and hence the Raman effect • This figure depicts “normal” (spontaneous) Raman effects Virtual state Virtual state hv1 – hv2 Anti-Stokes line hv1 hv1 – hv2 Stokes line hv1 Excited state (vibrational) Ground state (vibrational) Scattering timescale ~10-14 sec (fluorescence ~10-8 sec) H. A. Strobel and W. R. Heineman, Chemical Instrumentation: A Systematic Approach, 3rd Ed. Wiley: 1989.
More on Raman Processes • The Raman process: inelastic scattering of a photon when it is incident on the electrons in a molecule • When inelastically-scattered, the photon loses some of its energy to the molecule (Stokes process). It can then be experimentally detected as a lower-energy scattered photon • The photon can also gain energy from the molecule (anti-Stokes process) • Raman selection rules are based on the polarizability of the molecule • Polarizability: the “deformability” of a bond or a molecule in response to an applied electric field. Closely related to the concept of “hardness” in acid/base chemistry. P. W. Atkins and R. S. Friedman, Molecular Quantum Mechanics, 3rd Ed. Oxford: 1997.
If the incident radiation has frequency and the polarizability of the molecule changes between min and max at a frequency int as a result of this rotation/vibration: = max - min mean polarizability • Expanding this product yields: Anti-Stokes line Stokes line Rayleigh line More on Raman Processes • Consider the time variation of the dipole moment induced by incident radiation (an EM field): Induced dipole moment EM field polarizability P. W. Atkins and R. S. Friedman, Molecular Quantum Mechanics, 3rd Ed. Oxford: 1997.
Rayleigh line (elastic scattering) 0 = 20492 cm-1 0 = 488.0 nm Stokes lines (inelastic scattering) Anti-Stokes lines (inelastic scattering) 459 314 218 -218 -314 -459 400 200 0 -200 -400 Raman shift cm-1 0 = (s - 0) The Raman Spectrum of CCl4 Observed in “typical” Raman experiments Figure is redrawn from D. P. Strommen and K. Nakamoto, Amer. Lab., 1981, 43 (10), 72.
Raman-Active Vibrational Modes • Modes that are more polarizable are more Raman-active • Examples: • N2 (dinitrogen) symmetric stretch • cause no change in dipole (IR-inactive) • cause a change in the polarizability of the bond – as the bond gets longer it is more easily deformed (Raman-active) • CO2 asymmetric stretch • cause a change in dipole (IR-active) • Polarizability change of one C=O bond lengthening is cancelled by the shortening of the other – no net polarizability (Raman-inactive) • Some modes may be both IR and Raman-active, others may be one or the other!
The Raman Depolarization Ratio • Raman spectra are excited by linearly polarized radiation (laser). • The scattered radiation is polarized differently depending on the active vibration. • Using a polarizer to capture the two components leads to the depolarization ratio p: • The depolarization ratio p can be useful in interpreting the actual vibration responsible for a Raman signal.
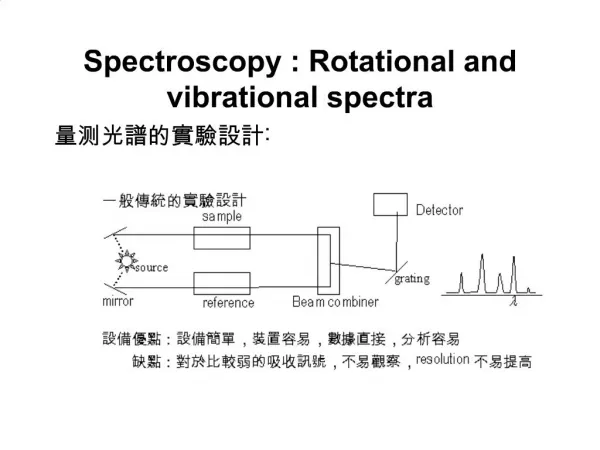
Instrumentation for Vibrational Spectroscopy • Absorption vs. Emission for IR spectroscopy: • Emission is seldom used for chemical analysis • The sample must be heated to a temperature much greater than its surroundings (destroying molecules) • IR emission is widely used in astronomy and in space applications. • Two IR Absorption methods: • Dispersive methods: Scanning of wavelengths using a grating (common examples are double-beam, like a spectrometer discussed in the optical electronic spectroscopy lecture). • Fourier-transform methods: based on interferometry, a method of interfering and modulating IR radiation to encode it as a function of its frequency. Radiation Source Sample Wavelength Selector Detector (transducer) Radiation Source Interferometer Sample Detector (transducer)
Why Build Instruments for Fourier Transform Work? • Advantages: • The Jacqinot (throughput) advantage: FT instruments have few slits, or other sources of beam attenuation • Resolution/wavelength accuracy (Connes advantage): achieved by a colinear laser of known frequency • Fellgett (multiplex) advantage: all frequencies detected at once, signal averaging • These advantages are critical for IR spectroscopy • The need for FT instruments is rooted in the detector • There are no transducers that can acquire time-varying signals in the 1012 to 1015 Hz range – they are not fast enough! • Why are FT instruments not used in UV-Vis? • The multiplex disadvantage (shot noise) adversely affects signal averaging – it is better to multiplex with array detectors (such as the CCD in ICP-OES) • In some cases, technical challenges to building interferometers with tiny mirror movements
Inteferometers for FT-IR and FT-Raman • The Michelson interferometer, the product of a famous physics experiment: Figures from Wikipedia.org • Produces interference patterns from monochromatic and white light
Inteferometers • For monochromatic radiation, the interferogram looks like a cosine curve • For polychromatic radiation, each frequency is encoded with a much slower amplitude modulation • The relationship between frequencies: • Where: • is the frequency of the radiation c is the speed of light in cm/s vm is the mirror velocity in cm/s • Example: mirror rate = 0.3 cm/s modulates 1000 cm-1 light at 600 Hz • Example: mirror rate = 0.2 cm/s modulates 700 nm light at 5700 Hz
The Basics of the Fourier Transform Continuous: • The conversion from time- to frequency domain: Discrete: FT FT
FTIR Spectrometer Design • It is possible to build a detector that detects multiple frequencies for some EM radiation (ex. ICP-OES with CCD, UV-Vis DAD) • FTIR spectrometers are designed around the Michelson interferometer, which modulates each IR individual frequency with an additional unique frequency: Fourier Transform - IR Spectrum IR Source Beamsplitter Michelson Interferometer Sample Detector Interferogram Fixed Mirror Moving Mirror
IR Sampling Methods: Absorbance Methods • Salt plates (NaCl): for liquids (a drop) and small amounts of solids. Sample is held between two plates or is squeezed onto a single plate. • KBr/CsI pellet: a dilute (~1%) amount of sample in the halide matrix is pressed at >10000 psi to form a transparent disk. • Disadvantages: dilution required, can cause changes in sample • Mulls: Solid dispersion of sample in a heavy oil (Nujol) • Disadvantages: big interferences • Cells: For liquids or dissolved samples. Includes internal reflectance cells (CIRCLE cells) • Photoacoustic (discussed later)
IR Sampling Methods: Reflectance Methods • Specular reflection: direct reflection off of a flat surface. • Grazing angles • Attenuated total reflection (ATR): Beam passed through an IR-transparent material with a high refractive index, causing internal reflections. Depth is ~2 um (several wavelengths) • Diffuse reflection (DRIFTS): a technique that collects IR radiation scattered off of fine particles and powders.Used for both surface and bulk studies. ATR DRIFTS Figures from http://www.nuance.northwestern.edu/KeckII/ftir7.asp
IR Sources • Nernst glower: a rod or cylinder made from several grams of rare earth oxides, heated to 1200-2200K by an electric current. • Globar: similar to the Nernst glower but made from silicon carbide, electrically heated. Better performance at lower frequencies. • Incandescent Wires: nichrome or rhodium, low intensity • Mercury Arc: high-pressure mercury vapor tube, electric arc forms a plasma. Used for far-IR • Tungsten filament: used for near-IR • CO2 Lasers (line source): high-intensity, tunable, used for quantitation of specific analytes.
IR Detectors • Thermal transducers • Response depends upon heating effects of IR radiation (temperature change is measured) • Slow response times, typically used for dispersive instruments or special applications • Pyroelectric transducers • Pyroelectric: insulators (dielectrics) which retain a strong electric polarization after removal of an electric field, while they stay below their Curie temperature. • DTGS (deuterated triglycine sulfate): Curie point ~47°C • Fast response time, useful for interferometry (FTIR) • Photoconducting transducers • Photoconductor: absorption of radiation decreases electrical resistance. Cooled to LN2 temperatures (77K) to reduce thermal noise. • Mid-IR: Mercury cadmium telluride (MCT) • Near-IR: Lead sulfide (NIR)
Raman Spectrometers • The basic design dispersive Raman scattering system: Sample Wavelength Selector Detector (photoelectric transducer) Radiation source (90° angle) • Special considerations: • Sources: lasers are generally the only source strong enough to scatter lots of light and lead to detectable Raman scattering • Avoiding fluorescence: He-Cd (441.6 nm), Ar ion (488.0 nm, 514.5 nm), He-Ne (632.8), Diode (782 or 830), Nd/YAG (1064)
Modern Raman Spectrometers • FT-Raman spectrometers – also make use of Michelson interferometers • Use IR (1 m) lasers, almost no problem with fluorescence for organic molecules • Have many of the same advantages of FT-IR over dispersive • But, there is much debate about the role of “shot noise” and whether signal averaging is really effective • CCD-Raman spectrometers – dispersive spectrometers that use a CCD detector (like the ICP-OES system described in the Optical Electronic lecture) • Raman is detected at optical frequencies! • Generally more sensitive, used for microscopy • Usually more susceptible to fluorescence, also more complex • Detectors - GaAs photomultiplier tubes, diode arrays, in addition to the above.
More on Raman • Raman can be used to study aqueous-phase samples • IR is normally obscured by H2O modes, these happen to be less intense in Raman • However, the water can absorb the scattered Raman light and will damp the spectrum, and lower its sensitivity • Raman has several problems: • Susceptible to fluorescence, choice of laser important • When used to analyze samples at temperatures greater than 250C, suffers from black-body radiation interference (so does IR) • When applied to darkly-colored samples (e.g. black), the Raman laser will heat the sample, can cause decomposition and/or more black-body radiation
Applications of Raman Spectroscopy • Biochemistry: water is not strongly detected in Raman experiments, so aqueous systems can be studied. Sensitive to e.g. protein conformation. • Inorganic chemistry: also often aqueous systems. Raman also can study lower wavenumbers without interferences. • Other unique examples: • Resonance Raman spectroscopy: strong enhancement (102 – 106 times) of Raman lines by using an excitation frequency close to an electronic transition (Can detect umol or nmol of analytes). • Surface-enhanced Raman (SERS): an enhancement obtained for samples adsorbed on colloidal metal particles. • Coherent anti-Stokes Raman (CARS): a non-linear technique using two lasers to observe third-order Raman scattering – used for studies of gaseous systems like flames since it avoids both fluorescence and luminescence issues.
Applications of Raman Spectroscopy • Raman in catalysis research (see C&E News, Oct. 13, 2006, pg. 59): • Useful for the study of zeolite interiors • Fluorescence can be a problem, but one approach is to use UV light (257 nm) which avoids it just like switching to the IR (but at the risk of decomposition) – See work from the Stair group at Northwestern • For uses of SERS: Catal. Commun 3 547 (2002). • Raman microscopy: offers sub-micrometer lateral resolution combined with depth-profiling (when combined with confocal microscopy)
Comparison of IR and Raman Spectroscopy • Advantages of Raman over IR: • Avoids many interferences from solvents, cells and sample preparation methods • Better selectivity, peaks tend to be narrow • Depolarization studies possible, enhanced effects in some cases • Can detect IR-inactive vibrational modes • Advantages of IR over Raman: • Raman can suffer from laser-induced fluorescence and degradation • Raman lines are weaker, the Rayleigh line is also present • Raman instruments are generally more costly • Spectra are spread over many um in the IR but are compressed into several nm (20-50 nm) in the Raman • Final conclusion – they are complementary techniques!
Interpretation of IR and Raman Spectra • General Features: • Stretching frequencies are greater (higher wavenumbers) than corresponding bending frequencies • It is easier to bend a bond than to stretch it • Bonds to hydrogen have higher stretching frequencies than those to heavier atoms. • Hydrogen is a much lighter element • Triple bonds have higher stretching frequencies than double bonds, which have higher frequencies than single bonds • Strong IR bands often correspond to weak Raman bands and vice-versa
Interpretation of IR and Raman Spectra Characteristic Vibrational Frequencies for Common Functional Groups See also Table 17-2 of Skoog, et al. More detailed lists are widely available. See R. M. Silverstein and F. X. Webster, “Spectrometric Identification of Organic Compounds”, 6th Ed., Wiley, 1998.
IR and Raman Spectra of an Organic Compound The IR and Raman spectra of flufenamic acid (an analgesic/anti-inflammatory drug):
IR and Raman Spectra of an Organic Compound The IR and Raman spectra of flufenamic acid (an analgesic/anti-inflammatory drug): Note – materials usually limit IR in this region
IR and Raman Spectra of an Organic Compound The IR and Raman spectra of tranilast:
IR Frequencies and Hydrogen Bonding Effects • IR frequencies are sensitive to hydrogen-bonding strength and geometry (plots of relationships between crystallographic distances and vibrational frequencies): G. A. Jeffrey, An Introduction to Hydrogen Bonding, Oxford, 1997.
Applications of Far IR Spectroscopy • Far IR is used to study low frequency vibrations, like those between metals and ligands (for both inorganic and organometallic chemistry). • Example: Metal halides have stretching and bending vibrations in the 650-100 cm-1range. • Organic solids show “lattice vibrations” in this region • Can be used to study crystal lattice energies and semiconductor properties. • The Far IR region also overlaps rotational bands, but these are normally not detectable in condensed-phase work
Terahertz Spectroscopy • A relatively new technique, addresses an unused portion of the EM spectrum (the “terahertz gap”): • 50 GHz (0.05 THz) to 3 THz (1.2 cm-1 to 100 cm-1) • Made possible with recent innovations in instrument design, accesses a region of crystalline phonon bands P. F. Taday and D. A. Newnham, Spectroscopy Europe, , www.spectroscopyeurope.com G. Winnewisser, Vibrational Spectroscopy 8 (1995) 241-253
Applications of Near IR Spectroscopy • Near IR – heavily used in process chemistry • Amenable to quantitative analysis usually in conjunction with chemometrics (calibration requires many standards to be run) • While not a qualitative technique, it can serve as a fast and useful quantitative technique especially using diffuse reflectance • Accuracy and precision in the ~2% range • Examples: • On-line reaction monitoring (food, agriculture, pharmaceuticals) • Moisture and solvent measurement and monitoring • Water overtone observed at 1940 nm • Solid blending and solid-state issues
Near IR Spectroscopy Figure from www.asdi.com. For more information see: 1. Ellis, J.W. (1928) “Molecular Absorption Spectra of Liquids Below 3 m”, Trans. Faraday Soc. 1928, 25, pp. 888-898. 2. Goddu, R.F and Delker, D.A. (1960) “Spectra-structure correlations for the Near-Infrared region.” Anal. Chem., vol. 32 no. 1, pp. 140-141. 3. Goddu, R.F. (1960) “Near-Infrared Spectrophotometry,” Advan. Anal. Chem. Instr. Vol. 1, pp. 347-424. 4. Kaye, W. (1954) “Near-infrared Spectroscopy; I. Spectral identification and analytical applications,” Spectrochimica Acta, vol. 6, pp. 257-287. 5. Weyer, L. and Lo, S.-C. (2002) Spectra-Structure Correlations in the Near-infrared, In Handbook of Vibrational Spectroscopy, Vol. 3, Wiley, U.K., pp. 1817-1837. 6. Workman, J. (2000) Handbook of Organic Compounds: NIR, IR, Raman, and UV-Vis Spectra Featuring Polymers and Surfactants, Vol. 1, Academic Press, pp. 77-197.
Near IR Spectrum of Acetone • NIR taken in transmission mode (via a reflective gold plate) on a Foss NIRsystems spectrometer • Useful for quick solvent identification
Near IR Spectrum of Water (1st Derivative) • 1st derivative (and 2nd derivative) allows for easier identification of bands