Download
1 / 18
210 likes | 427 Vues
Vibrational Spectroscopy for Pharmaceutical Analysis. Part VI. Interpretation of Infrared Spectra & Applications Rodolfo J. Romañach, Ph.D. Interpretation of Mid-IR Spectra.

E N D
Vibrational Spectroscopy for Pharmaceutical Analysis Part VI. Interpretation of Infrared Spectra & Applications Rodolfo J. Romañach, Ph.D.
Interpretation of Mid-IR Spectra • Mid-IR spectroscopy is a powerful tool for chemists that want to determine the structure of a process impurity or degradation product.
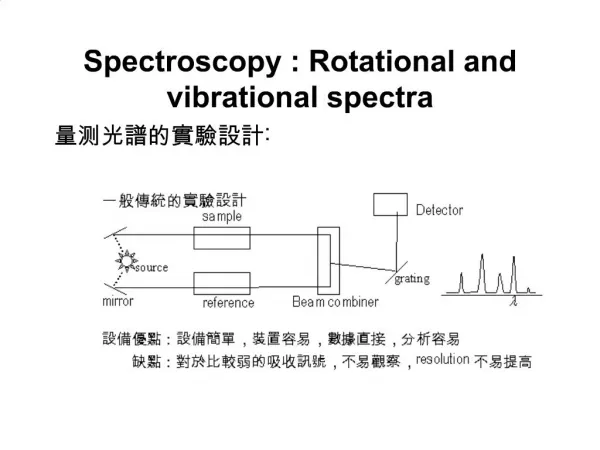
Dividing Line • 1500 cm-1 dividing line: above 1500 cm-1 if a band has a reasonable intensity, it is a group frequency. • Below 1500 cm-1 the band may be either a group or fingerprint frequency. • Below 1500 cm-1 called the fingerprint region.
Group Frequencies • Characteristic of functional groups such as -O-H, -CH3, -COCH3, and COOH. • Determined empirically by studying the spectra of many related molecules. • Always found in the spectrum of a molecule containing that group, and always occurs in the same narrow frequency range. • The form of the bands is nearly always the same in every molecule containing that group.
Fingerprint Frequencies • Highly Characteristic of the Specific Molecule. • Due to Vibrations of the Molecule as a whole. • The numerical values cannot be predicted in most cases. • Valuable in characterizing a molecule. • Fingerprint region is useful for discriminating between molecules that resemble each other.
Group Frequencies • O-H Stretch – Position is Highly Dependent on Hydrogen Bonding. • Intense – Easy to Identify. • Carboxylic Acids – Very broad and strong, form dimers. • This band will grow in intensity if you have a hygroscopic material.
C-O Single Bonds • This stretching will be observed for ethers, alcohols, esters, anhydrides, and carboxylic acids. • Present in carbohydrates (lactose, microcrystalline cellulose, mannitol are commonly used in pharmaceutical processing. • Very intense bands in 1000 – 1250 cm-1 region which are subject to erratic shifts from small structural changes.
C=O Stretch • Provides a very strong signal and is found in many organic molecules. • It occurs in a region of the spectrum where few other functional groups are observed. • Range of carbonyl frequencies is from 1750 ± 200 cm-1. The changes in frequency have been thoroughly studied and provide significant structural information.
Acetophenone – Notice Weak C-H stretch area in comparison with C=O stretch
Spectra of Two Different Crystal Habits N.R. Sperandeo, A. Karlsson, S. Cuffini, S. Pagola, and P.W. Stephens, AAPS PharmSciTech 2005; 6 (4) Article 82 (http://www.aapspharmscitech.org).
Information from PNQ Spectra • Spectra are very similar, indicating same compound. • O-H and N-H were free (not involved in hydrogen bonding) then absorbances near 3500 cm-1 would be observed. • The fact that N-H and O-H are near 3200 cm-1 is indicative that they are involved in hydrogen bonding. • Spectra were obtained with KBr pellets