ROTATIONAL - VIBRATIONAL SPECTROSCOPY
770 likes | 2.48k Vues
ROTATIONAL - VIBRATIONAL SPECTROSCOPY. Theory and Applications. Dr. N. K. Shukla Associate Professor Department of Chemistry Mahatma Gandhi P.G. College Gorakhpur-273001. SPECTROSCOPY - Study of spectral information. Physical stimulus. Detecting instrument. response. Molecule.

ROTATIONAL - VIBRATIONAL SPECTROSCOPY
E N D
Presentation Transcript
ROTATIONAL - VIBRATIONAL SPECTROSCOPY Theory and Applications Dr. N. K. Shukla Associate Professor Department of Chemistry Mahatma Gandhi P.G. College Gorakhpur-273001
SPECTROSCOPY - Study of spectral information Physical stimulus Detecting instrument response Molecule Visual (most common) representation, or Spectrum Upon irradiation with infrared light, certain bonds respond by vibrating faster. This response can be detected and translated into a visual representation called a spectrum.
EFFECT OF ELECTROMAGNETIC RADIATION ON MOLECULES Graphics source: Wade, Jr., L.G. Organic Chemistry, 5th ed. Pearson Education Inc., 2003
Infrared radiation is largely thermal energy. It induces stronger molecular vibrations in covalent bonds, which can be viewed as springs holding together two masses, or atoms. Specific bonds respond to (absorb) specific frequencies Graphics source: Wade, Jr., L.G. Organic Chemistry, 5th ed. Pearson Education Inc., 2003
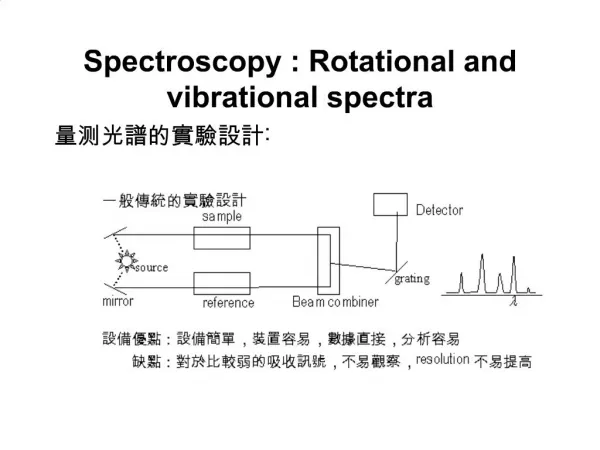
TRANSMISSION vs. ABSORPTION When a chemical sample is exposed to the action of IR LIGHT, it can absorb some frequencies and transmit the rest. Some of the light can also be reflected back to the source. Transmitted light IR source Chemical sample Detector From all the frequencies it receives, the chemical sample can absorb (retain) specificfrequencies and allow the rest to pass through it (transmitted light). The detector detects the transmitted frequencies, and by doing so also reveals the values of the absorbed frequencies.
VIBRATIONAL MODES • Covalent bonds can vibrate in several modes, including stretching, rocking, and scissoring. • The most useful bands in an infrared spectrum correspond to stretching frequencies, and those will be the ones we’ll focus on. Graphics source: Wade, Jr., L.G. Organic Chemistry, 5th ed. Pearson Education Inc., 2003
AN IR SPECTRUM IN ABSORPTION MODE The IR spectrum is basically a plot of transmitted (or absorbed) frequencies vs. intensity of the transmission (or absorption). Frequencies appear in the x-axis in units of inverse centimeters (wavenumbers), and intensities are plotted on the y-axis in percentage units. The graph above shows a spectrum in absorption mode.
AN IR SPECTRUM IN TRANSMISSION MODE The graph above shows a spectrum in transmission mode. This is the most commonly used representation and the one found in most chemistry and spectroscopy books. Therefore we will use this representation.
CLASSIFICATION OF IR BANDS IR bands can be classified as strong (s), medium (m), or weak (w), depending on their relative intensities in the infrared spectrum. A strong band covers most of the y-axis. A medium band falls to about half of the y-axis, and a weak band falls to about one third or less of the y-axis.
INFRARED ACTIVE BONDS Not all covalent bonds display bands in the IR spectrum. Only polar bonds do so. These are referred to as IR active. The intensity of the bands depends on the magnitude of the dipole moment associated with the bond in question: • Strongly polar bonds such as carbonyl groups (C=O) produce strong bands. • Medium polarity bonds and asymmetric bonds produce medium bands. • Weakly polar bond and symmetric bonds produce weak or non observable bands.
INFRARED BAND SHAPES Infrared band shapes come in various forms. Two of the most common are narrow and broad. Narrow bands are thin and pointed, like a dagger. Broad bands are wide and smoother. A typical example of a broad band is that displayed by O-H bonds, such as those found in alcohols and carboxylic acids, as shown below.
ROTATIONAL–VIBRATIONAL SPECTROSCOPY Rotational–vibrational spectroscopy is a branch of molecular spectroscopy concerned with infrared and Raman spectra of molecules in the gas phase. Transitions involving changes in both vibrational and rotational states can be abbreviated as rovibrational (or ro-vibrational) transitions. When such transitions emit or absorb photons(electromagnetic radiation), the frequency is proportional to the difference in energy levels and can be detected by certain kinds of spectroscopy. Since changes in rotationalc energy levels are typically much smaller than changes in vibrational energy levels, changes in rotational state are said to give fine structure to the vibrational spectrum. For a given vibrational transition, the same theoretical treatment as for pure rotational spectroscopy gives the rotational quantum numbers, energy levels, and selection rules. In linear and spherical top molecules, rotational lines are found as simple progressions at both higher and lower frequencies relative to the pure vibration frequency. In symmetric top molecules the transitions are classified as parallel when the dipole moment change is parallel to the principal axis of rotation, and perpendicular when the change is perpendicular to that axis.
ROTATIONAL–VIBRATIONAL SPECTROSCOPY Vibrational spectroscopy concerns molecules in the gas phase. There are sequences of quantized rotational levels associated with both the ground and excited vibrational states. The spectra are often resolved into lines due to transitions from one rotational level in the ground vibrational state to one rotational level in the vibrationally excited state. The lines corresponding to a given vibrational transition form a band.
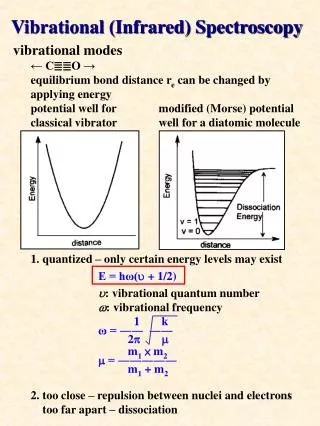
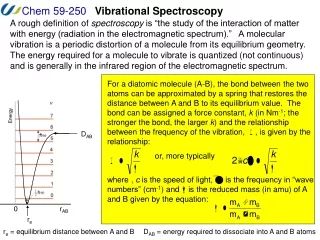
The Morse potential Energy Diagram The Morse potential, named after physicist Philip M. Morse, is a convenient model for the potential energy of a diatomic molecule. It is a better approximation for the vibrational structure of the molecule than the QHO (quantum harmonic oscillator) because it explicitly includes the effects of bond breaking, such as the existence of unbound states. It also accounts for the anharmonicity of real bonds and the non-zero transition probability for overtone and combination bands.
The Morse potential Energy Diagram The Morse potential (blue) and harmonic oscillator potential (green). Unlike the energy levels of the harmonic oscillator potential, which are evenly spaced by ħω, the Morse potential level spacing decreases as the energy approaches the dissociation energy. The dissociation energy Deis larger than the true energy required for dissociation D0 due to the zero point energy of the lowest (v = 0) vibrational level.
There is only a small correction from the ground state to the first excited state for the anharmonic correction, but it becomes much larger for more highly excited states which are populated as the temperature increases. The deviation from the harmonic oscillator to the anharmonic oscillator results in expanding the energy function with additional terms and treating these terms with perturbation theory. The results in the correct vibrational energies and also relaxes the selection rules. A Δv=±1 is still most predominant, however, weaker overtones with Δv=±2, ±3,… can occur. It should be noted that a Δv=2 transition does not occur at twice the frequency of the fundamental transition, but at a lower frequency.
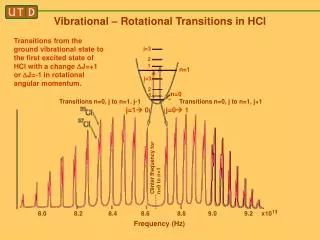
Fundamental vibrational frequencies of a molecule corresponds to transition from v=0 to v=1. • For a non-linear molecule there will by 3N-6 (where N is the number of atoms) number vibrations. • The same holds true for linear molecules, however the equations 3N-5 is used, because a linear molecule has one less rotational degrees of freedom. • Following Figure shows a diagram for a vibrating diatomic molecule. • The levels denoted by vibrational quantum numbers v represent the potenital energy for the harmonic (quadratic) oscillator. • The transition 0→1 is fundamental, transitions 0→n (n>1) are called overtones, and transitions 1→n (n<1) are called hot transitions (hot bands).
Overtones • Overtones occur when a vibrational mode is excited from v=0 to v=2, which is called the first overtone, or v=0 to v=3, the second overtone. • The fundamental transitions, v=±1, are the most commonly occurring, and the probability of overtones rapid decreases as v=±n increases. • Based on the harmonic oscillator approximation, the energy of the overtone transition will be about n times the fundamental associated with that particular transition. • The anharmonic oscillator calculations show that the overtones are usually less than a multiple of the fundamental frequency. • Overtones are generally not detected in larger molecules.
HCl vibrational spectrum.
Combination Bands • Combination bands are observed when more than two or more fundamental vibrations are excited simultaneously. • One reason a combination band might occur is if a fundamental vibration does not occur because of symmetry. • This is comparable to vibronic coupling in electronic transitions in which a fundamental mode can be excited and allowed as a “doubly excited state.” • Combination implies addition of two frequencies, but it also possible to have a difference band where the frequencies are subtracted..
Hot Bands • Hot bands are observed when an already excited vibration is further excited. • For example an v1 to v1' transition corresponds to a hot band in its IR spectrum. • These transitions are temperature dependent, with lower signal intensity at lower temperature, and higher signal intensity at higher temperature. • This is because at room temperature only the ground state is highly populated (kT ~ 200 cm-1), based on the Boltzmann distribution. • The Maxwell-Boltzmann distribution law states that if molecules in thermal equilibrium occupy two states of energy εjandεi, the relative populations of molecules occupying these states will be, • nj/ni= e−εj/RT / e−εi/RT=e−Δε/RT • where, k is the Boltzmann constant and T is the temperature in Kelvin.
Hot Bands In the harmonic oscillator model, hot bands are not easily distinguished from fundamental transitions because the energy levels are equally spaced. Because the spacing between energy levels in the anharmonic oscillator decrease with increasing vibrational levels, the hot bands occur at lower frequencies than the fundamentals. Also, the transition moment integrals are slightly different since the ground state will not necessarily be totally symmetric since it is not in v=0.
Fermi Resonance • Fermi resonance results in the splitting of two vibrational bands that have nearly the same energy and symmetry in both IR and Raman spectroscopies. • The two bands are usually a fundamental vibration and either an overtone or combination band. • The wavefunctions for the two resonant vibrations mix according to the harmonic oscillator approximation, and the result is a shift in frequency and a change in intensity in the spectrum. • As a result, two strong bands are observed in the spectrum, instead of the expected strong and weak bands. • It is not possible to determine the contribution from each vibration because of the resulting mixed wave function.
P, Q, R BRANCHES In the simplest cases the part of the infrared spectrum involving vibrational transitions with the same rotational quantum number (ΔJ = 0) in ground and excited states is called the Q-branch. On the high frequency side of the Q-branch the energy of rotational transitions is added to the energy of the vibrational transition. This is known as the R-branch of the spectrum for ΔJ = +1. The P-branch for ΔJ = −1 lies on the low wavenumber side of the Q branch. The appearance of the R-branch is very similar to the appearance of the pure rotation spectrum, and the P-branch appears as a nearly mirror image of the R-branch
INFORMATION OBTAINED FROM IR SPECTRA • IR is most useful in providing information about the presence or absence of specific functional groups. • IR can provide a molecular fingerprint that can be used when comparing samples. If two pure samples display the same IR spectrum it can be argued that they are the same compound. • IR does not provide detailed information or proof of molecular formula or structure. It provides information on molecular fragments, specifically functional groups. • Therefore it is very limited in scope, and must be used in conjunction with other techniques to provide a more complete picture of the molecular structure.
IR ABSORPTION RANGE The typical IR absorption range for covalent bonds is 600 - 4000 cm-1. The graph shows the regions of the spectrum where the following types of bonds normally absorb. For example a sharp band around 2200-2400 cm-1 would indicate the possible presence of a C-N or a C-C triple bond. Graphics source: Wade, Jr., L.G. Organic Chemistry, 5th ed. Pearson Education Inc., 2003
THE FINGERPRINT REGION Although the entire IR spectrum can be used as a fingerprint for the purposes of comparing molecules, the 600 - 1400 cm-1 range is called the fingerprint region. This is normally a complex area showing many bands, frequently overlapping each other. This complexity limits its use to that of a fingerprint, and should be ignored by beginners when analyzing the spectrum. As a student, you should focus your analysis on the rest of the spectrum, that is the region to the left of 1400 cm-1. Fingerprint region: complex and difficult to interpret reliably. Focus your analysis on this region. This is where most stretching frequencies appear. Graphics source: Wade, Jr., L.G. Organic Chemistry, 6th ed. Pearson Prentice Hall Inc., 2006
Carbon-Carbon Bonds • Increasing bond order leads to higher frequencies: • C-C 1200 cm-1(fingerprint region) • C=C 1600 - 1680 cm-1 • CC 2200 cm-1 (weak or absent if internal) • Conjugation lowers the frequency: • isolated C=C 1640-1680 cm-1 • conjugated C=C 1620-1640 cm-1 • aromatic C=C approx. 1600 cm-1 • C=C peaks are generally weak to moderate in intensity.
Carbon-Hydrogen Bonds • Bonds with more s character absorb at a higher frequency. • sp3 (alkane) C-H • just below 3000 cm-1 (to the right) • sp2 (alkene or aromatic hydrocarbon) C-H • just above 3000 cm-1 (to the left) • sp (alkyne) C-H • at 3300 cm-1
IR SPECTRUM OF ALKANES Alkanes have no functional groups. Their IR spectrum displays only C-C and C-H bond vibrations. Of these the most useful are the C-H bands, which appear around 3000 cm-1. Since most organic molecules have such bonds, most organic molecules will display those bands in their spectrum. Graphics source: Wade, Jr., L.G. Organic Chemistry, 5th ed. Pearson Education Inc., 2003
REFERENCES • Fundamentals of analytical chemistry, D.A. Skoog, D.M. West and F.J. Holler • Instrumental Methods of Chemical Analysis, B.K. Sharma • Instrumental Methods of Chemical Analysis, H. Kaur • Analytical Chemistry, Gary D. Christian • Quantitative inorganic analysis, A.I. Vogel