TECHNOLOGY SURVEY
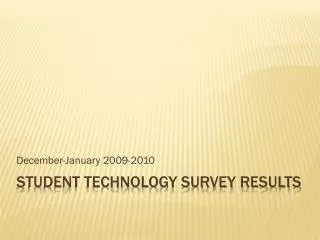
TECHNOLOGY SURVEY. ELEMENTARY. Southington Public Schools April 2012. Select your school?. 53.7%. Derynoski . (322). Kelley. 23.8%. (143). Plantsville. 22.5%. (135). Select your grade?. 34.3%. Grade 3 . (206). Grade 4. 33.8%. (203). Grade 5 . 31.8%. (191).

TECHNOLOGY SURVEY
E N D
Presentation Transcript
TECHNOLOGY SURVEY ELEMENTARY Southington Public Schools April 2012
Select your school? 53.7% Derynoski (322) Kelley 23.8% (143) Plantsville 22.5% (135) Select your grade? 34.3% Grade 3 (206) Grade 4 33.8% (203) Grade 5 31.8% (191)
Where do you access a computer most often? 82.7% 54.8% 15.3% 12.5% 10.3%
What electronic devices do you own? 66.7% 58.8% 44.5% 37.8% 31.0% 10.8%
Have you ever used a social networking site? 48.3 % YES (290) NO 51.7 % (310) If yes, which of the following social networking sites have you used?
Would you prefer to use an electronic device to read books?? 63.7% 36.3%
Would you prefer to use an electronic device for research? 91.7% 8.3%
On average, about how much time per day do you spend using an electronic device? 28.5% 21.2% 19.8% 11.7% 10.7% 8.2%
DERYNOSKI, KELLEY, PLANTSVILLE ELEMENTARY SCHOOLS Survey Questionnaire Results