Economic Context and Trends: A Look at Biomass, Homemakers, and Progress Indicators
90 likes | 207 Vues
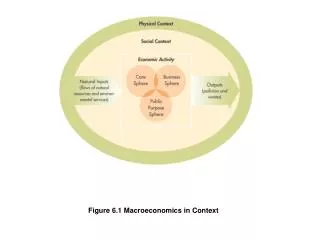
This compilation includes various important figures and data tables that highlight significant macroeconomic trends. Notable topics include the time trends of community biomass for large predatory fishes across diverse ecosystems and the changing proportions of full-time homemakers among all workers from 1870 to 2000. Additionally, it presents average daily hours spent in primary activities and the calculation of the 2002 Genuine Progress Indicator in billions of 1996 dollars, as well as comparisons of Real GDP per capita and GPI and the Human Development Index from 2003.

Economic Context and Trends: A Look at Biomass, Homemakers, and Progress Indicators
E N D
Presentation Transcript
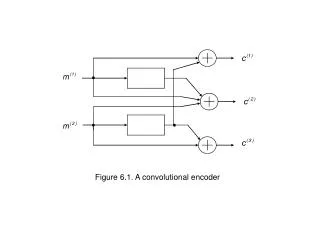
Figure 6.2 Time Trends of Community Biomass of Large Predatory Fishes in Various Ecosystems
Figure 6.3(a) Proportion of Full-Time Homemakers among All Workers, 1870
Figure 6.3(b) Proportion of Full-Time Homemakers among All Workers, 2000
Table 6.2 Calculating the 2002 Genuine Progress Indicator (in billions of 1996 dollars) (to be continued)
(continued) Table 6.2 Calculating the 2002 Genuine Progress Indicator (in billions of 1996 dollars)