Download
1 / 14
140 likes | 253 Vues
This analysis explores the evolutionary variations in early Silurian brachiopods, specifically Dicoelosia biloba from Sweden and D. hibernica from Ireland. Principal component analysis indicates two distinct species based on size differences, despite some overlap. Additionally, we investigate sexual dimorphism in the Jurassic ammonite Kosmoceras, illustrating size differences between male and female specimens. The research also delves into developmental patterns in ichthyosaurs, heterochronic evolution in brachiopods and rhynchosaurs, and the implications of Hox genes in tetrapod limb development.

E N D
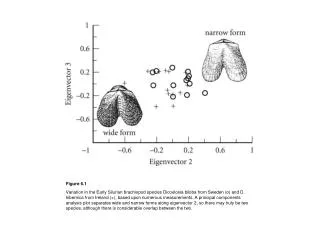
Figure 6.1 Variation in the Early Silurian brachiopod species Dicoelosia biloba from Sweden (o) and D. hibernica from Ireland (+), based upon numerous measurements. A principal components analysis plot separates wide and narrow forms along eigenvector 2, so there may truly be two species, although there is considerable overlap between the two.
Figure 6.2 Sexual dimorphism in ammonites, the Jurassic Kosmoceras. The larger shell (a) was probably the female, the smaller (b) the male. (Courtesy of Jim Kennedy and Peter Skelton.)
Figure 6.3 Adult female Ichthyosaurus (a) from the Lower Jurassic of Somerset, England, showing an embryo that has just been born (arrow), and detail of the curled embryo (b). (Courtesy of Makoto Manabe.)
Figure 6.4 Tests of allometry in the ichthyosaur Ichthyosaurus. (a) Plot of orbit length against skull length, and (b) plot of skull length against backbone length. The Somerset embryo (Fig. 6.3b) is indicated by a solid circle. Both graphs show negative allometry (orbit diameter 0.355 (skull length)0.987; skull length 1.162 (backbone length)0.933), confirming that embryos and juveniles had relatively large heads and eyes. (Courtesy of Makoto Manabe.)
Figure 6.5 Positive allometry in the antlers of the giant Irish deer Megaloceros. (a) A famous photograph of an Irish deer skeleton mounted in Dublin in Victorian times. (b) Positive allometry in the antlers of modern deer, showing that Megaloceros (M) falls precisely on the expected trend of its closest living relatives. Note that the fallow deer (D) plots above the slope (i.e. antlers are larger than expected from its height), and the European and American moose (A) plot below the line (i.e. antlers are smaller than expected from their height). Two regression lines, the reduced major axis (steeper) and least squares regression, are shown. The allometric equation is antler length 0.463 (shoulder height)1.74. (Based on information in Gould 1974.)
Figure 6.6 Hints of ancestry in modern animals. (a) Extra toes in a horse, an example of an atavistic abnormality in development, or a throw-back, to earlier horses which had more than one toe; normal horse leg (left), extra toes (right). (b) The vestigial hip girdle and hindlimb of a whale; the rudimentary limb is the rudiment of a hindlimb that functioned 50 Ma.
Figure 6.7 Heterochronic evolution in the Cenozoic brachiopods Tegulorhynchia and Notosaria. Adults of more recent species are like juveniles of the ancestor. Hence, pedomorphosis (“juvenile formation”) is expressed in this example. (Based on McNamara 1976.)
Figure 6.8 Heterochronic evolution in the Triassic rhynchosaurs. The skull of adult (A) Late Triassic forms developed beyond the size and shape limits seen in earlier Triassic adult forms. Here, the juveniles (J) of the descendants resemble the ancestral adults, and this is thus an example of peramorphosis (“beyond formation”). (Based on Benton & Kirkpatrick 1989.)
Figure 6.9 Hox genes and the development of the tetrapod limb. (a) The sequence of growth of a tetrapod limb bud, reading from top to bottom, showing how the stylopod (humerus/femur), zeugopod (forearm/calf) and autopod (hand/foot) differentiate. The pattern is determined by turning on (filled squares) and off (open squares) of Hox genes D-9 to D-13. (b, c) Interpretation of the forelimbs of the osteolepiform fish Eusthenopteron (b) and the tetrapod Acanthostega (c) in terms of development. The developmental axis (solid line) branches radial elements (dashed lines) in a pre-axial (anterior) direction in both forms, and the digits of tetrapods condense in a post-axial direction. (a, based on Shubin et al. 1997; b, c, courtesy of Mike Coates.)
Figure 6.10 The use of a modern analog to interpret a mysterious fossil. (a) A colony of the pseudoplanktonic crinoid Traumatocrinus attached to a fossil piece of driftwood, from the Late Triassic of China. (b) Reconstruction of the crinoids in life, showing how the wind pulled the log to the left, and the dangling crinoids captured plankton like a net. (c) A tow-net used to maximize catches of fish, a possible modern analog that explains the feeding mode of the fossil colony. (Courtesy of Wang Xiaofeng.)
Figure 6.11 Basic mechanical models for biological structures. There are different kinds of levers in use in everyday appliances, and these styles may be seen in biological structures. (a) In a class 1 lever the effort and load are on opposite sides of the fulcrum. (b, c) In class 2 and 3 levers the effort and load are on the same side of the fulcrum, with the effort furthest away in a class 2 lever (b), and closest in a class 3 lever (c).
Figure 6.12 Finite element analysis of the skull of Tyrannosaurus rex. The skull (a) was converted into a cell mesh (b), and biting forces applied (c). In the stress visualization (c), high stresses are indicated by pale colors, low stresses by black. Each bite, depending on its strength and location, sends stress patterns through the skull mesh and these allow the paleobiologist to understand the construction of the skull, but also the maximum forces possible before the structure fails. (Courtesy of Emily Rayfield.)
Figure 6.13 The running stride of Tyrannosaurus rex. (a) The main components of a stride, showing the stance phase when the foot touches the ground, and the swing phase. (b–d) Three positions of the limb in early stance, mid-stance and late stance, as the body moves forward, and showing the main forces, including the ground reaction force (GRF). (e–g) Three alternative postures for the limb, with the body held high or low. Read more, and see the movies at http://www.rvc.ac.uk/AboutUs/Staff/jhutchinson/ResearchInterests/beyond/Index.cfm. (Courtesy of John Hutchinson.)
Figure 6.14 Evidence for a rodent–plant interaction from the Eocene. (a) Seed of the water plant Stratiotes carrying a neat hole gnawed by a rodent, from the Eocene Bembridge Limestone Formation of the Isle of Wight, southern England. (b) A hole gnawed by a modern woodmouse, showing the same kind of perpendicular narrow grooves made by the tips of the upper incisors. Scale bars, 1 mm. (Courtesy of Margaret Collinson.)