Download
1 / 26
270 likes | 506 Vues
The Environmental and Social Consequences of Human Population. I. Population Growth and Poverty. Poverty is defined as the inability to meet basic economic needs.

E N D
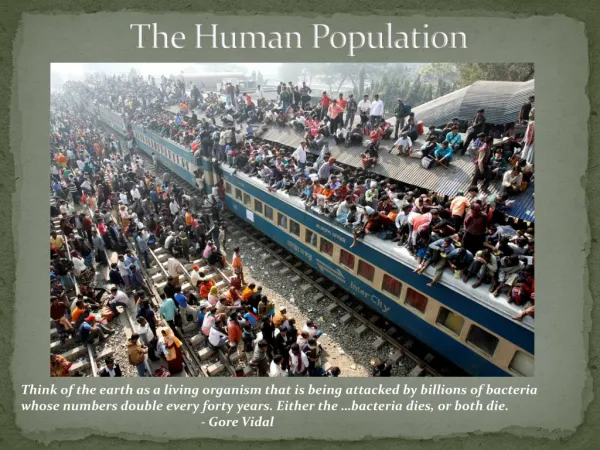
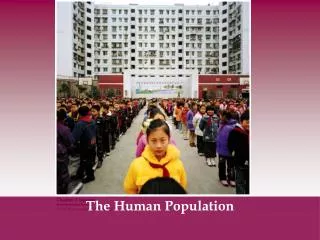
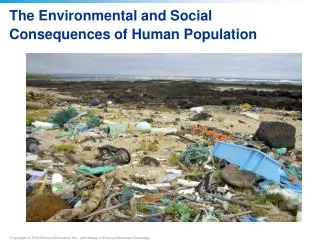
The Environmental and Social Consequences of Human Population
I. Population Growth and Poverty • Poverty is defined as the inability to meet basic economic needs. • According to the UN, about 1.1 billion people struggle to live on less than $1 a day, and about half the world’s population lives on less than $2 a day. • Poverty has numerous harmful health and environmental effects, and has been identified as one of the five major causes of the environmental problems we face.
I. Population Growth and Poverty D. Reducing poverty lowers population growth! E. Most classical economists believe that a growing economy can help the poor by creating more jobs and providing more tax revenues, which can therefore help the poor (trickle-down economics). However since 1960 most of the benefits of global economic growth have been flooding up to the rich, rather than trickling down to the bottom fifth of the workers on the economic ladder.
1) The stark contrast between affluent and poor societies causes social and environmental stress 2) The richest 20% use 86% of the world’s resources Leaves 14% of the resources for 80% of the world’s people to share F. The wealth gap and population growth cause conflict
I. Population Growth and Poverty G. Since 1980, the wealth gap has continued to grow. In 2006, the world’s three richest people had a combined wealth greater than that of the world’s 48 poorest countries. H. Some nations have climbed out of abject poverty in a short time (and therefore drastically reduced their annual growth rate). For example, South Korea and Singapore made the journey from developing nations to achieving world-class industrial status in just two decades – by focusing on hard work, education, and discipline, all of which reduced poverty and increased investment capital.
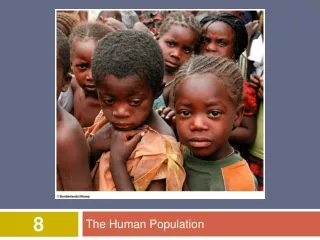
II. Population Increase and Food Insecurity • Many of the poor have health problems because they do not get enough to eat. These people face food insecurity – living with chronic hunger and poor nutrition, which threatens their ability to lead healthy and productive lives. • The root cause of food insecurity is poverty (people don’t have enough money to buy food for their family), but other obstacles to food security are political upheaval, corruption, and war.
II. Population Increase and Food Insecurity C. People who cannot grow or buy enough food to meet their basic energy needs suffer from chronic undernutriation, or hunger. D. Most of the world’s chronically undernourished children live in developing countries, and face the possibilities of suffering from mental retardation and stunted growth, and dying from infectious diseases such as measles and diarrhea, which rarely kill children in developed countries.
II. Population Increase and Food Insecurity E. Many of the world’s poor can afford to only live on a low-protein, high-carbohydrate vegetarian diet and often suffer from chronic malnutrition. F. According to the UN, the estimate of the worldwide number of malnourished people fell from 918 million in 1970 to 862 million in 2006. According to a 2007 study, because of the massive diversion of corn to produce ethanol, the number of malnourished people could actually increase to 1.2 billion by 2025.
Change in World Commodity Prices, January 2010 to January 2011
III. The Environmental Impacts of a Growing Population A. The IPAT model: I = P x A x T x S 1) Our total impact (I) on the environment results from the interaction of population (P), affluence (A) and technology (T), with an added sensitivity (S) factor 2) Population = individuals need space and resources 3) Affluence = greater per capita resource use 4) Technology = increased exploitation of resources 5) Sensitivity = how sensitive an area is to human pressure • Further model refinements include education, laws, ethics
III. The Environmental Impacts of a Growing Population B. Simulations project trends in population, food, pollution, and resource availability C. If the world does not change, population and production will suddenly decrease D. In a sustainable world, population levels off, production and resources stabilize, and pollution declines
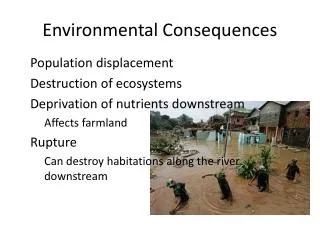
E. Poverty results in environmental degradation - Africa’s Sahel region and western China is turning to desert – over-use of limited water resources
F. Wealth also produces severe environmental impacts 1) Affluent societies have enormous resource consumption and waste production • People use resources from other areas, as well as from their own • Individuals’ ecological footprints are huge One American has as much environmental impact as 6 Chinese or 12 Indians or Ethiopians
The Earth can’t support our consuming lifestyle Humanity’s global ecological footprint surpassed Earth’s capacity to support us in 1987
IV. Population Growth and Disease • Mortality and morbidity are two terms used worldwide to discuss disease. Mortality is the number of people who die of a disease per 100,000 people in the population, and morbidity is the number of people infected with the disease in the population, per 100,000. • Transmissible or infectious diseases can be spread from person to person (colds, flu, HIV, measles) while nontransmissible diseases don’t spread, and usually tend to develop slowly (cancer, heart disease).
IV. Population Growth and Disease C. In 1900, infectious disease was the leading cause of death in the world and the U.S., but since the 1950’s, rates of death from infectious disease have been greatly reduced. Today only 7% of deaths in the U.S. and 30% of deaths worldwide are caused by infectious disease. • The two leading causes of death in the U.S. are Cardiovascular disease (39%) and Cancer (23%). E. Infectious diseases are still major health threats, and threats include increasing antibiotic resistant bacteria, and increasing range and pesticide resistance of mosquitoes, which are vectors for malaria and west Nile virus.
IV. Population Growth and Disease F. Case Study 1: Malaria 1) One in every 5 people in the world are at risk for Malaria, which is caused by a parasite (protozoa) that is spread by mosquito bites. There is no vaccine and most Anopheles mosquito species that carry the parasite are resistant to insecticides. Additionally, global warming has increased the range (specifically to higher elevations) of Anopheles mosquitoes, and many malarial protozoans are resistant to the first-line malarial drugs.
G. Case Study 2: HIV/AIDS 1) Of 40 million in the world infected, 27 million live in sub-Saharan Africa 2) Low rates of contraceptive use spread the disease • 1 in 5 South Africans are infected
H. Demographic changes caused by HIV have severe effects 1) 6,000 Africans die each day • Increased infant mortality • Life expectancy fell from 59 to 40 • Millions of orphans created 2) Young, productive people die • Communities break down • Income and food production decline • Medical expenses and debt skyrocket. AIDS undermines the transition of developing countries to modern technologies
IV. Population Growth and Disease G. Case Study 3: Tuberculosis • Caused by a respiratory bacteria – airborne spread to people with long-term contact. Has two phases, latent and active. Only contagious in active form. Most people with active TB do not know they have it – and typically infect 10 to 15 other people. 9.2 million new infections are diagnosed each year. • Has been around since antiquity – and is completely widespread worldwide – over 1/3 of the population of the planet is infected (most with latent infections).
H. TB can be treated with a course of four antibiotics over a period of 6 to 8 months, but MDR – TB is common, and XDR-TB is spreading rapidly. XDR-TB can not be treated effectively with drugs, and from the first case being diagnosed in 2006, to today, there are now about 500,000 cases of XDR-TB diagnosed a year. • Morbidity: South Africa 998 per 100,000 US: 5.2 per 100,000, Texas 5.8 per 100,000 (not including border counties) Travis county 5.3 per 100,000 Border counties 13.3 per 100,000 Cameron county 18.8
Emerging Infectious Disease • SARS: Severe acute respiratory syndrome (SARS) is a serious form of pneumonia. It is caused by a virus that was first identified in 2003. Infection with the SARS virus causes acute respiratory distress (severe breathing difficulty) and sometimes death. • First diagnosed in 48 yr old businessman who had traveled to Guangdong province of China, through Hong Kong, to Hanoi, Vietnam. The businessman and the doctor who first diagnosed SARS both died from the illness.
Cases appeared in Asia, Europe, Australia, North and South America. Hong Kong and Singapore schools closed. 2003 outbreak – 8,000 cases, 750 deaths.
H1N1 Flu Aka Swine Flu • 2009 H1N1 (sometimes called “swine flu”) is a new influenza virus causing illness in people. This new virus was first detected in people in the United States in April 2009. On June 11, 2009, the World Health Organization (WHO) declared that a pandemic of 2009 H1N1 flu was underway. • The 2009 H1N1 had very high morbidity because very few people under 60 had antibodies to this virus. Mortality not any higher than traditional flu, although more young than old people.
U.S. CDC declared “public health emergency” for 2009 flu season, WHO pandemic.