Download
1 / 48
490 likes | 592 Vues
The SDSS and the Era of Astronomical Surveys. Alex Szalay. Big Data in Science. Data growing exponentially, in all science All science is becoming data-driven This is happening very rapidly Data becoming increasingly open/public Non-incremental!

E N D
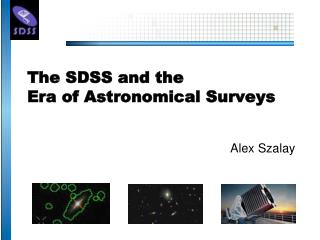
The SDSS and the Era of Astronomical Surveys Alex Szalay
Big Data in Science • Data growing exponentially, in all science • All science is becoming data-driven • This is happening very rapidly • Data becoming increasingly open/public • Non-incremental! • Convergence of physical and life sciences through Big Data (statistics and computing) • The “long tail” is important • A scientific revolution in how discovery takes place => a rare and unique opportunity
Science is Changing THOUSAND YEARS AGO science was empirical describing natural phenomena LAST FEW HUNDRED YEARS theoretical branch using models, generalizations LAST FEW DECADES a computationalbranch simulating complex phenomena TODAY data intensive science, synthesizing theory, experiment and computation with statistics ►new way of thinking required!
Sloan Digital Sky Survey • “The Cosmic Genome Project” • Started in 1992, finished in 2008 • Data is public • 2.5 Terapixels of images => 5 Tpx • 10 TB of raw data => 120TB processed • 0.5 TB catalogs => 35TB in the end • Database and spectrograph built at JHU (SkyServer) • Data served from FNAL • Now SDSS-3, imaging completed • SDSS-3 data served from JHU
The Telescope Special 2.5m telescope 3 degree field of view Wind screen moved separately
The Photometric Survey Continuous data rate of 8 Mbytes/sec Northern Galactic Cap drift scan of 10,000 square degrees 5 broad-band filters exposure time: 55 sec pixel size: 0.4 arcsec astrometry: 60 mas calibration: 2% at r'=19.8 done only in best seeing (20 nights/year) Southern Galactic Cap multiple scans (> 30 times) of the same stripe u‘ g' r‘ i ' z’ 22.3 23.3 23.1 22.3 20.8
The Spectroscopic Survey • SDSS Redshift Survey • 1 million galaxies • 900,000 r’ limited • 100,000 red galaxies • volume limited to z=0.45 • 100,000 quasars • 100,000 stars • Two high throughput spectrographs • spectral range 3900-9200 Å • 640 spectra simultaneously • R=2000 resolution, 1.3 Å • Features • Automated reduction of spectra • Very high sampling density and completeness • Objects in other catalogs also targeted
Skyserver • Prototype in 21st Century data access • 1.2B web hits in 12 years • 200M external SQL queries • 4,000,000 distinct users vs. 15,000 astronomers • The emergence of the “Internet scientist” • The world’s most used astronomy facility today • Collaborative server-side analysis done by 7Kastronomers Jim Gray
40 million visual galaxy classifications by the public Enormous publicity (CNN, Times, Washington Post, BBC) 300,000 people participating, blogs, poems… Original discoveries by the public (Voorwerp, Green Peas) Chris Lintott et al GalaxyZoo
SkyServer Goals • Provide easy, visual access to exciting new data • “hot off the press” • Illustrate that advanced content does not mean a cumbersome interface • Understand new ways of publishing scientific data • Demonstrate how to take analyses inside the DB • Heavy use of user defined functions • Target audience • Advanced high-school students, amateur astronomers, wide public • Multilingual capabilities built in from the start • Heavy use of stylesheets, language branches
DB Loading • Wrote automated table driven workflow system for loading • Two-phase parallel load • Over 16K lines of SQL code, mostly data validation • Loading process was extremely painful • Lack of systems engineering for the pipelines • Lots of mismatches • Fixing files corrupted in data processing (RAID5 disk errors) • Most of the time spent on scrubbing data • Once data is clean, everything loads in 1 week • Reorganization of data is <1 week
Data Delivery • Small requests (<100MB) • Anonymous, putting data on the stream • Medium requests (<1GB) • Queues with resource limits • Large requests (>1GB) • Save data in scratch area and use async delivery • Only practical for large/long queries • Iterative requests/workbench • Save data in temp tables in user space • Let user manipulate via web browser • Paradox: if we use web browser to submit, users want immediate response even from large queries
CASJOBS/MyDB: Workbench • Need to register ‘power users’, with their own DB • Query output goes to ‘MyDB’ • Can be joined with source database • Results are materialized from MyDB upon request • Users can do: • Insert, Drop, Create, Select Into, Functions, Procedures • Publish their tables to a group area • Data delivery via the CASJobs (C# WS) • Batch scheduler for large queries • First example of “cloud computing” in science (2003) => Sending analysis to the data!
MyDB • Implemented by Nolan Li, from user feedback • Results are materialized from MyDB upon request • Users can collaborate! • Insert, Drop, Create, Select Into, Functions • Publish/share their tables to a group area • Flexibility “at the edge”/ Read-only big DB • 6,800 registered users
EDR DR1 DR1 DR2 DR2 DR2 DR3 DR3 DR3 DR3 Data Versions • June 2001: EDR with 100GB • 2003 DR2, 2004: DR3, 2005 DR4 • 2006 DR5, with 2.4TB, 2007: DR6, 2008: DR7, with 10TB • 3 versions of the data • Target, Best, Runs • Total catalog volume 5TB • Data publishing: once published, must stay • SDSS: DR1 is still used
EDR: Early Data Release • SDSS Early Data Release (June 6, 2001) • 100 GB catalogs, few hundred square degrees • SkyServer aimed solely at public outreach • Built in 2 weeks by Szalay and Gray (20 hour days) • Web site design by Szalay • Images converted in PhotoShop scripts • Content writing by Stephen Landy • Hardware donated by Compaq • Highly interactive, using browser independent DHTML (“browser hell”)
DR1: Data Release 1 • The first main data release of SDSS (May 2003) • 1.1TB of catalogs, linked to 6TB of low level data • SkyServer has undergone a major facelift • New graphic design by Curtis Wong, Asta Roseway (MS) • Modified stylesheets and embedded scripts only • Web site translated in 2 days • New visual tools using Web Services • Szalay, Gray, Maria Nieto-SantiSteban • API’s published • Formal helpdesk in place • Created MySkyServer • 0.65GB laptop version
DR2: Data Release 2 • Live in March 15, 2004, with 2.2 TB of catalogs • Only incremental changes in interface • Web site under source control • Color images dramatically improved • New translations under way • Japanese, French, German, Spanish, Hungarian • Tools overhauled • now embraced by professional astonomers • Enormously increased traffic • Moving to 3-way web front end + 3 DB servers • Collaborative tools: MyDB with group access
Visual Tools • Goal: • Connect pixel space to objects without typing queries • Browser interface, using common paradigm (MapQuest) • Challenge: • Images: 200K x 2K x1.5K resolution x 5 colors = 3 Terapix • 300M objects with complex properties • 20K geometric boundaries and about 6M ‘masks’ • Need large dynamic range of scales (2^13) • Assembled from a few building blocks: • Image Cutout Web Service • SQL query service + database • Images+overlays built on server side -> simple client
User Level Services • Three different applications on top of the same core • Finding Chart (arbitrary size) • Navigate (fixed size, clickable navigation) • Image List (display many postage stamps on same page) • Linked to • One another • Image Explorer (link to complex schema) • On-line documentation
Images • 5 bands, 2048x1489 resolution (u,g,r,i,z), 6MB each • Raw size 200Kx6MB = 1.2TB • For quick access they must be stored in the DB • It has to show well on screens, remapping needed • Remapping must be uniform, due to image mosaicking • Built composite color, using lambda mapping • (g->B, r->G, i->R), u,z was too noisy • Many experiments, discussions with Robert Lupton • Asinh compression • Resulting image stored as JPEG • From 30MB->300kB : a factor 100 compression
Object Overlays • Object positions stored in (ra,dec) • At run time, convert (ra,dec)-> (screen_x, screen_y) • Plotting pixel space quantities, like outlines: • We could do (x,y)->(ra,dec)->(screen) • For each field we store local affine transformation matrix: • (x,y) -> (screen) • Apply local projection matrix and plot in pixel coordinates • GDI plots correctly on the screen! • Whole web service less than 1500 lines of C# code
Geometries • SDSS has lots of complex boundaries • 60,000+ regions • 6M masks, represented as spherical polygons • A GIS-like computational geometry library built in SQL, then converted to C++ • Converted to C# for direct plugin into SQL Server2005 (17 times faster than C++) • Precompute arcs and store in database for rendering • Functions for point in polygon, intersecting polygons, polygons covering points, all points in polygon • Using spherical quad-tree index (HTM)
Current Status • SDSS-II finished with DR7 • Database a bit over 10TB • SDSS-III • One last run of imaging, completed area between Southern stripes, then turned off imaging camera • Rebuilt spectrographs, mostly LRG (BOSS) • DR8 in 2011, DR9 in July 2012, DR10 in June 2013 • Database over 12TB • AS3 (After Sloan 3) is in the formation process • New special instruments (Integral field spectrograph unit)
SDSS III 14,555 square degrees 2,674,200 specObj
Numerous Science Projects • 5,000 publications, 200,000 citations • More papers from outside the collaboration • From cosmology/LSS to galaxy evolution, quasars, stellar evolution, even time-domain • Combination of 5-band photometry and matching spectroscopy provided unique synergy • Overall, seeing not as good as originally hoped for, but systematic errors extremely well understood • Very uniform, statistically complete data sets • Photometry entirely redone for DR9, using cross-scans to calibrate the zero points across the stripes
The Broad Impact of SDSS • Changed the way we do astronomy • Remarkably fast transition seen for the community • Speeded up the first phase of exploration • Wide-area statistical queries easy • Multi-wavelength astronomy is the norm • SDSS earned the TRUST of the community • Enormous number of projects, way beyond original vision and expectation • Many other surveys now follow • Established expectations for data delivery • Serves as a model for other communities of science
Astro-Statistical Challenges • The crossmatch problem (multi-, time domain) • Photometric redshifts (prediction/regression problem) • Correlations (auto/cross, higher order) • Outlier detection in many dimensions • Statistical errors vssystematics • Comparing observations to models • comparing distributions, updating models • The “unknown unknown”, when we have no models • ….. • Scalability!!!
Finding the Bumps – DR4 • Eisenstein et al (2005) – LRG sample Correlation function
Primordial Sound Waves in SDSS Power Spectrum (Percival et al 2006, 2007) SDSS DR6+2dF SDSS DR5 800K galaxies
The Impact of GPUs • We need to reconsider the N logN only approach • Once we can run 100K threads, maybe running SIMD N2 on smaller partitions is also acceptable • Recent JHU effort on integrating CUDA with SQL Server, using SQL UDF • Galaxy spatial correlations: 600 trillion real and random galaxy pairs using brute force N2 • Much faster than the tree codes! • This is because high resolution wasneeded… Tian, Budavari, Neyrinck, Szalay 2010
Photometric Redshifts • Normally, distances from Hubble’s Law • Measure the Doppler shift of spectral lines • distance! • But spectroscopy is very expensive • SDSS: 640 spectra in 45 min vs. 300K 5 color images in 1min • Future big surveys will have no spectra • Idea: • Multicolor images are like a crude spectrograph • Statistical estimation of the redshifts/distances
Random Forest • Recent effort at JHU • S. Carliles, C. Priebe, A. Szalay, T. Budavari, S. Heinis • RF: Leo Berman and Adele Cutler • Create many (~500) random subsamples of training set (about 2/3 each) • Build a piecewise linear regression Tree for each • These Trees make up the Forest: each provides an estimated parameter value • Their mean and sigma is the value and error of thefinal estimate robust!
Zspec vs Zrf Carliles et al 2009
RF on Cyberbricks • 36-node Amdahl cluster using 1200W total • Zotac Atom/ION motherboards • 4GB of memory, N330 dual core Atom, 16 GPU cores • Aggregate disk space 43.6TB • 63 x 120GB SSD = 7.7 TB • 27x 1TB Samsung F1 = 27.0 TB • 18x.5TB Samsung M1= 9.0 TB • Blazing I/O Performance: 18GB/s • Amdahl number = 1 for under $30K • Using the GPUs for data mining: • 6.4B multidimensional regressions (photo-z) in 5 minutes over 1.2TB of data • Running the Random Forest algorithm inside the DB
Photo-z Bias vs. Galaxy Inclination • Edge-on galaxies are redder, mimic higher redshift galaxies • Photo-z bias is -0.02 for face-on galaxies • SDSS disk galaxiess, Spec-z = 0.065-0.075, a 30% effect! • Once axial ratio isincluded in RF training, bias goes away C-W Yip et al. 2011
Field of Streams Belokurov et al 2006
The SDSS Genealogy SDSSSkyServer OncoSpace Life Under Your Feet Super COSMOS Hubble Legacy Arch SkyQuery CASJobs MyDB GalaxyZoo Turbulence DB JHU 1K Genomes GALEX Pan-STARRS Millennium Palomar QUEST UKIDDS VO Services Open SkyQuery INDRA Simulation Potsdam Milky Way Laboratory MHD DB VO Footprint VO Spectrum
Trends CMB Surveys • 1990 COBE 1000 • 2000 Boomerang 10,000 • 2002 CBI 50,000 • 2003 WMAP 1 Million • 2008 Planck 10 Million • Angular Galaxy Surveys • 1970 Lick 1M • 1990 APM 2M • 2005 SDSS 200M • 2008 VISTA 1000M • 2012 PS1 1500M • 2018 LSST 3000M • Time Domain • QUEST • SDSS Extension survey • Dark Energy Survey • Pan-STARRS • LSST… • Galaxy Redshift Surveys • 1986 CfA 3500 • 1996 LCRS 23000 • 2003 2dF 250000 • 2006 SDSS 500000 • 2012 BOSS 1000000 1 Petabyte/year today…
Survey Trends T.Tyson (2010)
SDSS 2.4m 0.12Gpixel PanSTARRS 1.8m 1.4Gpixel LSST 8.4m 3.2Gpixel
Continuing Growth How long does the data growth continue? • High end always linear • Exponential comes from technology + economics • rapidly changing generations • like CCD’s replacing plates, and become ever cheaper • How many generations of instruments are left? • Are there new growth areas emerging? • Software is becoming a new kind of instrument • Value added data • Hierarchical data replication • Large and complex simulations
Why Is Astronomy Interesting? • Approach inherently and traditionally data-driven • Cannot do experiments in the lab… • Important spatio-temporal features • Very large density contrasts in populations • Real errors and covariances • Many signals very subtle, buried in systematics • Data sets large, pushing scalability • LSST will be 100PB “Exciting, since it is worthless!” — Jim Gray
Non-Incremental Changes Astronomy has always been data-driven….now becoming more generally accepted • Science is moving increasingly from hypothesis- driven to data-driven discoveries • Data collection in collaborations, increasingly separate from analyses by small groups • Need new randomized, incremental algorithms • Best result in 1 min, 1 hour, 1 day, 1 week • New computational tools and strategies … not just statistics, not just computer science, not just astronomy, not just genomics… • Need new data intensive scalable architectures
Summary • Science is increasingly driven by data (large and small) • Changing sociology – surveys analyzed by individuals • From hypothesis-driven to data-driven science • We need new instruments: “microscopes” and “telescopes” for data • There is a challenge on the “long tail” • Data changes not only science, but society • A new, Fourth Paradigm of Science is emerging… • SDSS has been at the cusp of this transition A convergence of statistics, computer science, physical and life sciences…..