Sportscard Survey Experiment Setup and Analysis
Explore the experimental setup of a sportscard survey, analyze trading behavior, test popularity, and investigate the endowment effect.


Sportscard Survey Experiment Setup and Analysis
E N D
Presentation Transcript
Experiments I will try and post the slides used in class each week on my website http://samuelmarden.weebly.com/
(a) What is the experimental setup? • Approaches people at a sportscard convention and asks if they’d be willing to complete a survey. • Randomly gives accepters either ‘Card A’ or ‘Card B’. • Why is it important that it is random? • Why is it important that they give the card after people have accepted.? • After they complete the survey give them the opportunity to trade Why should we expect exactly half of people to trade?
(b) What Percentage of people did trade? use "data-exercise-10-sportscards", clear . sum Variable | Obs Mean Std. Dev. Min Max -------------+-------------------------------------------------------- trade | 148 .3378378 .474579 0 1 trades_p_m | 148 10.24324 10.10127 0 70 years_trade | 148 8.655405 8.316006 0 60 dealer | 148 .5 .5016978 0 1 goodb | 148 .527027 .5009643 0 1 -------------+-------------------------------------------------------- income | 148 4.148649 1.987597 1 8 education | 148 3.628378 1.467472 1 6 male | 148 .8986486 .3028182 0 1 age | 148 34.68919 13.01849 10 76 Is this percentage statistically different from 50%? • Specify the null and alternative hypothesis. • Specify the confidence interval and rejection region • Can we perform the test with the information here?
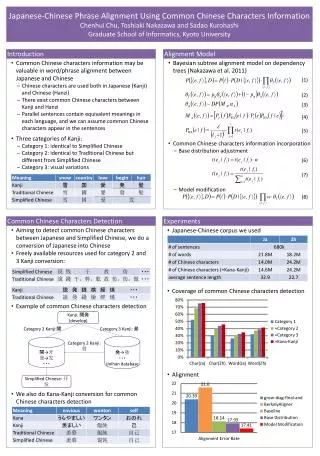
(c) Is there any evidence that one of the two ‘sportscards’ was more popular? What test shall we run?
(c) Is there any evidence that one of the two ‘sportscards’ was more popular? ttest trade, by(goodb) Two-sample t test with equal variances ------------------------------------------------------------------------------ Group | Obs Mean Std. Err. Std. Dev. [95% Conf. Interval] ---------+-------------------------------------------------------------------- 0 | 70 .3285714 .0565445 .4730851 .2157683 .4413746 1 | 78 .3461538 .0542159 .4788222 .2381961 .4541116 ---------+-------------------------------------------------------------------- combined | 148 .3378378 .0390102 .474579 .2607447 .414931 ---------+-------------------------------------------------------------------- diff | -.0175824 .0783882 -.1725045 .1373397 ------------------------------------------------------------------------------ diff = mean(0) - mean(1) t = -0.2243 Ho: diff = 0 degrees of freedom = 146 Ha: diff < 0 Ha: diff != 0 Ha: diff > 0 Pr(T < t) = 0.4114 Pr(|T| > |t|) = 0.8228 Pr(T > t) = 0.5886 Although it doesn’t matter for the validity of the experiment, it is helpful that the two items seem equally popular. Why?
(c) Is there an endowment effect amongst dealers? What test shall we run?
(c) Is there an endowment effect amongst dealers? ttest trade == .50 if dealer == 1 One-sample t test ------------------------------------------------------------------------------ Variable | Obs Mean Std. Err. Std. Dev. [95% Conf. Interval] ---------+-------------------------------------------------------------------- trade | 74 .4459459 .0581776 .5004626 .3299982 .5618937 ------------------------------------------------------------------------------ mean = mean(trade) t = -0.9291 Ho: mean = .50 degrees of freedom = 73 Ha: mean < .50 Ha: mean != .50 Ha: mean > .50 Pr(T < t) = 0.1779 Pr(|T| > |t|) = 0.3559 Pr(T > t) = 0.8221
(e) Are the measures of experience in the data set correlated? corr dealer trades_p_myears_trade (obs=148) | dealer trades~myears_~e -------------+--------------------------- dealer | 1.0000 trades_p_m | 0.4551 1.0000 years_trade | 0.2063 0.0400 1.0000
(e) Are the measures of experience in the data set correlated? pwcorr dealer trades_p_myears_trade, sig | dealer trades~myears_~e -------------+--------------------------- dealer | 1.0000 | | trades_p_m | 0.4551 1.0000 | 0.0000 | years_trade | 0.2063 0.0400 1.0000 | 0.0119 0.6290 |
(e) Do people with above average experience trade more often? What test shall we run? Which average should we use?
kdensitytrades_p_m Mean=10.2, median=8
sumtrades_p_m, d ttest trade==0.5 if trades_p_m>r(p50) One-sample t test ------------------------------------------------------------------------------ Variable | Obs Mean Std. Err. Std. Dev. [95% Conf. Interval] ---------+-------------------------------------------------------------------- trade | 69 .4927536 .0606275 .5036102 .3717733 .613734 ------------------------------------------------------------------------------ mean = mean(trade) t = -0.1195 Ho: mean = 0.5 degrees of freedom = 68 Ha: mean < 0.5 Ha: mean != 0.5 Ha: mean > 0.5 Pr(T < t) = 0.4526 Pr(|T| > |t|) = 0.9052 Pr(T > t) = 0.5474 sumtrades_p_m, d ttest trade==0.5 if trades_p_m>r(mean) One-sample t test ------------------------------------------------------------------------------ Variable | Obs Mean Std. Err. Std. Dev. [95% Conf. Interval] ---------+-------------------------------------------------------------------- trade | 49 .5102041 .0721538 .5050763 .3651292 .6552789 ------------------------------------------------------------------------------ mean = mean(trade) t = 0.1414 Ho: mean = 0.5 degrees of freedom = 48 Ha: mean < 0.5 Ha: mean != 0.5 Ha: mean > 0.5 Pr(T < t) = 0.5559 Pr(|T| > |t|) = 0.8881 Pr(T > t) = 0.4441
sumyears_trade, d ttest trade==0.5 if years_trade>r(p50) One-sample t test ------------------------------------------------------------------------------ Variable | Obs Mean Std. Err. Std. Dev. [95% Conf. Interval] ---------+-------------------------------------------------------------------- trade | 71 .3802817 .0580231 .4889112 .2645583 .4960051 ------------------------------------------------------------------------------ mean = mean(trade) t = -2.0633 Ho: mean = 0.5 degrees of freedom = 70 Ha: mean < 0.5 Ha: mean != 0.5 Ha: mean > 0.5 Pr(T < t) = 0.0214 Pr(|T| > |t|) = 0.0428 Pr(T > t) = 0.9786 What do we conclude about the effect of experience?
f) Regress the dummy variable trade on one of the measures of trading experience and these additional control variables using both OLS and probit models. What do you conclude from the results? reg trade dealer age male income education, robust probit trade dealer age male income education
Probit with marginal effects calculated. Where are they calculated?
(g) Are there any apparent problems with the internal validity of the results that we have obtained? What conclusions would you draw from this experiment for studies that are trying to evaluate how much people are willing to pay for a particular intervention, such as, for example, a nature conservation project?