CHEMISTRY 11
CHEMISTRY 11. TODAY’S OBJECTIVE: To learn about the meaning of precision/ accuracy in science and the difference between the two To learn about and how to report uncertainty and types of errors in measurements. 1.3 Measuring and Recording Significant Data. p g . 32 - 44.

CHEMISTRY 11
E N D
Presentation Transcript
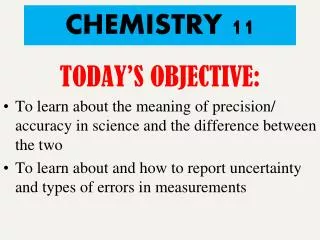
CHEMISTRY 11 TODAY’S OBJECTIVE: • To learn about the meaning of precision/ accuracy in science and the difference between the two • To learn about and how to report uncertainty and types of errors in measurements
1.3 Measuring and Recording Significant Data pg. 32 - 44
Precision and accuracy In everyday language: it means the same thing In science: precision and accuracy have different meanings REMEMBER!! We can never make a perfect measurement! The best we can dois to come as close as possible within the limitations of the measuring instruments.
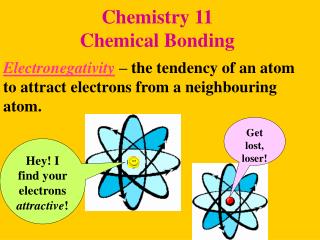
Precision and accuracy Accuracy: is how close a measured value is to the actual (true) value Precision: is how close the measured values are to each other (exactness) or how well the measurement can be repeated (reproducibility)
For Example: Imagine a game of Darts: You played 3 games and you got these results: 1 2 3 • You had high accuracy but very low precision.
For Example: Imagine a game of Darts: You played 3 games and you got these results: 1 2 3 • You had high accuracy but very low precision.Why?
For Example: Imagine a game of Darts: You played 3 games and you got these results: 1 2 3 1. You had high accuracy but very low precision.because you were very close to the true result (the red middle part). But your darts were not very close to each other!
For Example: Imagine a game of Darts: You played 3 games and you got these results: 1 2 3 • You had low accuracy and very high precision.
For Example: Imagine a game of Darts: You played 3 games and you got these results: 1 2 3 2. You had low accuracy but very high precision.Why?
For Example: Imagine a game of Darts: You played 3 games and you got these results: 1 2 3 2. You had low accuracy but very high precision.because you were not very close to the true result (the red middle part). And your darts were very close to each other!
For Example: Imagine a game of Darts: You played 3 games and you got these results: 1 2 3 3. You had high accuracy and very high precision.
For Example: Imagine a game of Darts: You played 3 games and you got these results: 1 2 3 3. You had high accuracy and very high precision.why?
For Example: Imagine a game of Darts: You played 3 games and you got these results: 1 2 3 3. You had high accuracy and very high precision.because you were very close to the true result (the red middle part). And your darts were very close to each other!
Two students performed four trials to measure the mass of 5 mL of water. The graphs show their results. The true value (result) for the mass of water is 5 g.
3 STUDENTS MEASURE TEMPERATURE OUTSIDE ON A NICE, SUNNY SUMMER DAY. THE ACTUAL TEMPERATURE (actual value) WAS 30.5°C Here are their results: STUDENT 1: 30.5 °C, 30.9°C, 30.8°C STUDENT 2: 30.1 °C, 30.9°C, 31.5°C STUDENT 3: 31.5 °C, 31.4°C, 31.5°C a) Graph all four sets of data. b) Which results are most precise? c) Which results are most accurate? d) Which results have the highest accuracy and precision?
Precision and accuracy STUDENT 1: 30.5 °C, 30.9°C, 30.8°C STUDENT 2: 30.1 °C, 30.9°C, 31.5°C STUDENT 3: 31.5 °C, 31.4°C, 31.5°C a) Graph all four sets of data. b) Which results are most precise? c) Which results are most accurate? d) Which results have the highest accuracy and precision? a) b) Student 3 c) Student 1 d) Student 1
PRECISION OF LABORATORY EQUIPMENT What quantities these do these instruments measure and what are their names?
But they can never give EXACT measurement = they are not perfect They all have different precision (exactness)
WHICH EQUIPMENT WOULD YOU USE TO DELIVER 20.5 mL OF A LIQUID? Graduated Cylinder
WHICH EQUIPMENT IS THE LEAST PRECISE? TestTubes
syringe Graduated cylinder no
SYSTEMATIC ERROR Your measurements are ALWAYStoo low or too high in the same direction!
SYSTEMATIC ERROR For example: At the beginning of an experiment, you forgot to RESET your scale to 0.0000, so your measurements are all wrong
RANDOM ERROR Your measurements are SOMETIMEStoo low and SOMETIMEStoo high in both directions!
RANDOM ERROR For example: YOU make mistakes during an experiment (not being careful, spilling, losing chemicals, not reading the numbers properly etc…)
Groups 1 and 3 -> low precision, as the points are spread out Groups 2 and 4 -> high precision, as the points are close to each other Groups 1 and 2 -> low accuracy Groups 3 and4 -> high accuracy Groups 1 and 2 -> errors in the same direction Groups 3 and 4 -> errors in high and low directions
RANGE UNCERTAINTY The most precise instruments have the smallest UNCERTAINTIES(mistakes) To report the uncertainty, we use:
RANGE UNCERTAINTY ≈+/– ½ of the smallest division marked on a measuring scale Smallest division = 1 mL Range uncertainty = +/- 0.5 mL 56.3 mL +/- 0.5 mL
What is the RANGE UNCERTAINTY in these pictures? 26 mL +/- 1 mL
What is the RANGE UNCERTAINTY in these pictures? 34˚C +/- 1 ˚C
What is the RANGE UNCERTAINTY in these pictures? 23 mL +/- 0.5 mL 30 mL +/- 0.5 mL
What is the RANGE UNCERTAINTY in these pictures? 350 mL +/- 25 mL
Adding Range Uncertainties 42.4 mL +/- 0.4 mL 12.6 mL +/- 0.4 mL
Multiplying Range Uncertainties 5 m +/- 1 m 8 m +/- 1 m Step 1: Find the maximum and minimum values Step 2: Results (max + min value) +/- (max - min value) 2 2
TYPES OF UNCERTAINTY IN MEASUREMENTS Absolute Uncertainty how much higheror lowera measured value is than an accepted (true) value Absolute Uncertainty = |measured–accepted value|
3 STUDENTS MEASURED TEMPERATURE OUTSIDE ON A NICE, SUNNY SUMMER DAY. THE ACTUAL TEMPERATURE (actual value) WAS 30.5°C Here are their results: STUDENT 1: 30.5 °C STUDENT 2: 30.1 °C STUDENT 3: 31.5 °C The actual (accepted) value was: 30.5˚C Absolute Uncertainty? STUDENT 1: |30.5 – 30.5 | = no error STUDENT 2: |30.1 – 30.5 | = 0.4 °C STUDENT 3: |30.5 – 31.5| = 1.0 °C Absolute Uncertainty = |measured–accepted value|
TYPES OF UNCERTAINTY IN MEASUREMENTS Percentage Error
3 STUDENTS MEASURED TEMPERATURE OUTSIDE ON A NICE, SUNNY SUMMER DAY. THE ACTUAL TEMPERATURE (actual value) WAS 30.5°C Here are their results: STUDENT 1: 30.5 °C STUDENT 2: 30.1 °C STUDENT 3: 31.5 °C The actual (accepted) value was: 30.5˚C Percentage Error? STUDENT 1: |(30.5 – 30.5)| / 30.5 = no error STUDENT 2: |(30.1 – 30.5)|/ 30.5 = 1.3 °C STUDENT 3: |(30.5 – 31.5)| / 30.5 = 3.3 °C
HOMEWORK 2 worksheets
QUIZ 2 days from now – Wednesday, February 19 Accuracy + precision Range uncertainty + arithmetic Absolute Uncertainty, Percentage Errors Types of errors Reading glassware uncertainty