Download
1 / 16
170 likes | 342 Vues
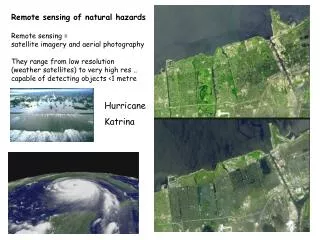
Detailed examination of the impact of Hurricane Katrina in New Orleans using Landsat 5 imagery and classification techniques. Analysis includes flood extent, land cover changes, accuracy assessments, and real-world applications.

E N D
Hurricane Katrina Damage Analysis Remote sensing of natural resources Alex Stern and William Tran
Overview • Assess the flood extent and impact created by Hurricane Katrina in New Orleans • Examining Orleans Parish Duke University
Initial Steps • Collect Data • Landsat 5 images from August 25th, 2005 and September 7th, 2005 • Extract to Orleans Parish using Arc Map, Parish shapefile
Classification • Supervised classification for both images • Landsat 5 bands 1,2,3,4, and 7 • Five land cover classes • Urban, Vegetation, Wetland, Water, and Flooded Urban
Accuracy Assessment 2005 NAIP 2m orthophoto mosaic Class Reference Classified Number Producers Users Name Totals Totals Correct Accuracy Accuracy Class 0 38 54 38 --- --- Urban 16 25 10 62.50% 40.00% Vegetation 38 20 20 52.63% 100.00% Wetlands 15 24 11 73.33% 45.83% Flooded 1 0 0 --- --- Water 42 27 27 64.29% 100.00% Overall Classification Accuracy = 70.67% Overall Kappa Statistics = 0.6291 Class Name Kappa Class 0 0.6032 Urban 0.3284 Vegetation 1.0000 Wetlands 0.3981 Flooded 0.0000 Water 1.0000 *No accuracy assessment performed on post-storm image
Change Detection • 37 sq miles of flooded urban • 54 sq miles of flooded land • Increase of water and vegetation • Urban class lost 56 sq. miles • Evaluated over total land area: • 134,585 persons displaced, 16,697 housing units damaged • Evaluated over urban land area: • 281,332 persons displaced, 34,916 housing units damaged • Loss of wetlands, errors • 4 sq miles of wetlands changed to urban
Problems and Limitations • Inaccuracy of classifications • Inaccuracy of census data interpretation and analysis • Limitation of area analyzed • Technical Errors • ArcMap conversions • Differences in shapefiles • Multiple extractions
Real World Application • FEMA • Military • Insurance rates
Questions? NASA/Jeff Schmaltz, MODIS