Download
1 / 41
410 likes | 554 Vues
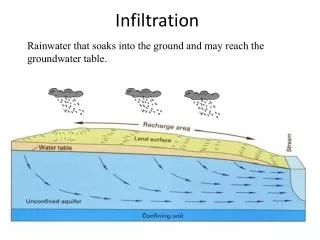
Infiltration Through Compacted Urban Soils and Effects on Biofiltration. Robert Pitt Department of Civil and Environmental Engineering University of Alabama Tuscaloosa, AL 35487 Shen-en Chen, Shirley Clark, and Choo Keong Ong Department of Civil and Environmental Engineering

E N D
Infiltration Through Compacted Urban Soils and Effects on Biofiltration Robert Pitt Department of Civil and Environmental Engineering University of Alabama Tuscaloosa, AL 35487 Shen-en Chen, Shirley Clark, and Choo Keong Ong Department of Civil and Environmental Engineering The University of Alabama at Birmingham Birmingham, AL 35226
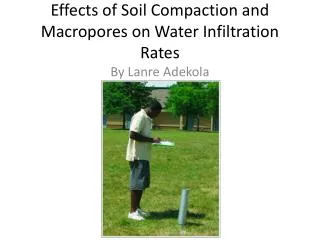
Abstract • Previous research identified significant reductions in infiltration rates in disturbed urban soils. • More than 150 prior tests were conducted in predominately sandy and clayey urban soils in the Birmingham and Mobile, Alabama, areas. • Infiltration in clayey soils was found to be affected by an interaction of soil moisture and compaction, while infiltration in sandy soils was affected by soil compaction alone.
Applications of These Data • Newer tests were conducted under more controlled laboratory conditions and represent a wider range of soil textures and specific soil density values. • The high head conditions during these tests make these results suitable for biofiltration/infiltration devices that have 1 to 2 ft of head, but are likely too high for normal infiltration rates through urban soils.
Infiltration Rates during Prior Tests of Disturbed Urban Soils
Infiltration Measurements for Noncompacted, Sandy Soils (Pitt, et al. 1999)
Infiltration Measurements for Dry-Noncompacted, Clayey Soils (Pitt, et al. 1999)
Method • These newer tests were run for up to 20 days, although most were completed (when steady low rates were observed) within 3 or 4 days. • Initial soil moisture levels were about 8% (sand was about 3%), while the moisture levels after the tests ranged from about 20 to 45%. • Three methods were used to compact the test specimens: hand compaction, plus two Proctor test methods. • Both Modified and Standard Proctor Compactions follow ASTM standard (D 1140-54).
Method (cont.) • Hand compaction (gentle hand pressing to force the soil into the mold with as little compaction as possible), • Standard Proctor Compaction (24.4 kN hammer dropped 25 times form 300 mm on each of 3 soil layers). • Modified Proctor Compaction (44.5 kN hammer dropped 25 times from 460 mm on each of 5 soil layers).
Method (cont.) • A total of 7 soil texture types were tested representing all main areas of the standard soil texture triangle. • Three levels of compaction were tested for each soil. • Only 15 tests resulted in observed infiltration. The Standard and Modified Proctor clay tests, the Modified Proctor clay loam, and all of the clay mixture tests did not result in any infiltration, even after several days.
The Source Loading and Management Model (SLAMM) • Developed during past 25 years during EPA, state, and Canadian funded research. • Identifies pollutant sources during different rain and climatic conditions. • Prioritizes subwatersheds and critical source areas. • Evaluates alternative development scenarios, pollution prevention, and combinations of source area and outfall control options.
Conclusions • These tests indicated that both texture and compaction were important in determining the infiltration rates, with time since the beginning of rain only important for less than half of the conditions tested. • These tests were conducted using a 1.1 m head and are most appropriate for biofiltration and infiltration designs where ponded water may occur. A series of tests were also conducted for sandy loam using 0.1 m head and the resulting infiltration rates were substantially less.
Conclusions (cont.) • These results (and those from the previous tests), however, do indicate significant effects associated with soil compaction. The prior field tests of infiltration rates for disturbed urban soils provided basic rates (and COV values) that are recommended for typical urban hydrology studies. • SLAMM can be used to quantify the benefits of alternative soil structures and modifications on infiltration and biofiltration options.
Acknowledgements Our earlier disturbed soil tests are described in the following EPA research report. Funding for this initial work was provided by the EPA and is gratefully acknowledged. The recent tests reported in this poster were conducted as an individual research project by C.K. Ong, a soil engineering student at UAB, under the direction of Dr. Shen-en Chen. Their dedicated help is greatly appreciated.
References Pitt, R., J. Lantrip, R. Harrison, C. Henry, and D. Hue. Infiltration through Disturbed Urban Soils and Compost-Amended Soil Effects on Runoff Quality and Quantity. U.S. Environmental Protection Agency, Water Supply and Water Resources Division, National Risk Management Research Laboratory. EPA 600/R-00/016. Cincinnati, Ohio. 231 pgs. December 1999. NRCS. Soil Quality Institute 2000, Urban Technical Note 2, as reported by Ocean County Soil Conservation District, Forked River, NJ. 2001.


![SOILM – Percentage of soils with medium infiltration capacity [%]](https://cdn2.slideserve.com/4698308/slide1-dt.jpg)