Download

1 / 47
470 likes | 582 Vues
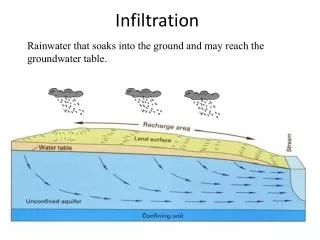
Learn about soil composition, formation factors, horizons, and the impact of climate and landscape on soil development. Discover the role of infiltration, drainage, and the importance of soil in the ecosystem.

E N D
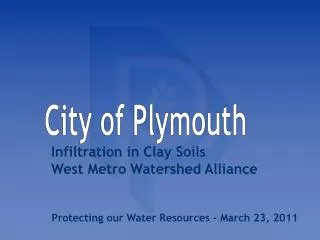
Soils, Infiltration, and On-site Testing Presented by: Mr. Brian Oram, PG, PASEOWilkes UniversityGeoEnvironmental Sciences and Environmental Engineering DepartmentWilkes - Barre, PA 18766570-408-4619 http://www.water-research.net
Soils Defined • Natural Body that Occurs on the Land Surface that are Characterized by One or More of the Following: • Consists of Distinct Horizons or Layers • The ability to support rooted plants in a naturalenvironment • Upper Limit is Air or Shallow Water • Lower Limit is Bedrock or Limit of Biological Activity • Classification based on a typical depth of 2 m or approximately 6.0 feet
Another Definition of Soils • A Natural 3 - Dimensional Body at the Earth Surface • Capable of Supporting Plants • Properties are the Result of Parent Material, Climate, Living Matter, Landscape Positionand Time. • Soil Composed of 4 Components (mineral matter, organic matter, air, and water)
Five Soil Formation Factors • Organisms • Climate • Time • Topography and Landscape Setting • Parent Material R
Soil Food Web - Organisms • Micro & Macroscopic • Decomposition of Organic Matter • Animals Living in Soil • Vegetation Types • Human Activity • Redoximorphic Feature Formation Image Source: The University of Minnesota, 2003
Climatic Elements(Energy & Precipitation) • Annual and Seasonal Rainfall • Temperature Range • Biologic Production and Activity • Weathering (Wind, Water, and Ice) • Translocation of Material
Climate and Soil Development Image Source: University of Wisconsin, 2002
Geologic Time Time
Landscape and Relief(Soil Texture) A- Sandy Texture andLoamy SandB- Sandy Textures C- Clay Loam, Loam, Silt Loam Image Source: University of Wisconsin, 2002
Landscape and Relief (Drainage) Water MovementSoil DrainageLandscape Configuration (Convex, Concave)ElevationWater Movement Image Source: NJ NRCS, 2002
Parent Material • Geological Materials • Minerals and Rocks • Glacial Materials • Loess (wind blown) • Alluvial Deposits • Marine Deposits • Organic Deposits • Influences • Minerals Present • Colors • Chemical Reactions • Water Movement • Soil Development Glacial Material Bedrock
Soil Horizons • Layer of Soil Parallel to Surface • Properties a function of climate, landscape setting, parent material, biological activity, and other soil forming processes. • Horizons (A, E, B, C, R, etc) Image Source: University of Texas, 2002
Soil HorizonsO- Organic Horizons • Organic Layers of Decaying Plant and Animal Tissue • Aids Soil Structural Development • Helps to Retain Moisture • Enriches Soil with Nutrients • Infiltration Capacity function of Organic Decomposition O Horizon Dark in Color Because of Humus Material - 1,000,000 bacteria per cm3
Soil HorizonsA Horizons: “ Topsoil” • Mineral Horizon NearSurface • Accumulation of OrganicMaterial • Eluviation Process Moves Humic and Minerals from O Horizon into A horizon • Ap - Plowed A Horizon • Ab - Buried Horizon • Soil dark in color, coarser in texture, and high porosity A Horizon
Soil Horizons: E HorizonsAlbic Horizon (Latin - White) • Mineral Horizon NearSurface • Movement of Silicate Clay, Iron, and Aluminum from the A Horizon through Eluviation • Horizon does not mean a water table is present, but the horizon can be associated with high water table , use Symbol Eg (gleyed modifier) • Underlain by a B (illuvial) horizon E Horizon
Soil Horizons: B HorizonsZone of Maximum Accumulation • Mineral Horizon • Illuviation is Occurring - Movement into the Horizon • B Horizon Receives Organic and Inorganic Materials from Upper Horizons. • Color Influence by Organic, Iron, Aluminum, and Carbonates • Bw - Weakly Colored or Structured • Bhs- Accumulation of illuvial organic material and sesquioxides • Bs- Accumulation of sesquioxides • Bt- Translocation of silicate clay • Bx- Fragipan Horizon, brittle Bhs Horizon Bs Horizon Bw Horizon
Soil Horizons: Bx and Bt Horizons Horizons Indicate Reduced Infiltration Capacity and Permeability Bx: B horizon with fragipan, a compact, slowly permeable subsurface horizon that is brittle when moist and hard when dry.Prismatic soil structure, mineral coatings and high bulk density Area of Highest Permeability along Prism Contact Bt: Clay accumulation is indicated by finer soil textures and by clay coating peds and lining pores
C- HorizonsDistinguished by Color, Structure, and Deposition • Mineral Horizon or Layer, excluding Rock • Little or No Soil-Forming • May be Similar to Overlying Formation • May be Called Parent Material • Layer can be Gleyed • Developed in Place or Deposited
R- Horizons • Hard, Consolidated Bedrock • Typically Underlies a C Horizon, but could be directly below an A or B Horizon. R Horizon
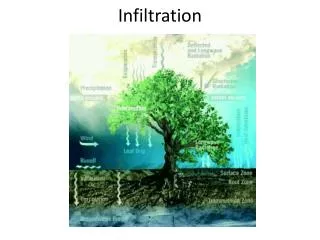
Soil Hydrologic Cycle Source: Vepraskas, M.J, et. Al. “ Wetland Soils”, 2001.
Soil Drainage Class and Soil Group Soil Drainage Class - Refers to Frequency and Duration of Periods of Saturation or Partial Saturation During Soil Formation. There are 7 Natural Soil Drainage Classes. Hydrologic Soil Group-Refers to Soils Runoff Producing Characteristics as used in the NRCS Curve Number Method. There area 4 Hydrologic Soil Groups (A, B, C, D).
Group A and B • Group A is sand, loamy sand or sandy loam types of soils. It has low runoff potential and high infiltration rates even when thoroughly wetted. Deep, well to excessively drained sands or gravels and have a high rate of water transmission. Root Limiting / Impermeable layers over 100 cm or 40 inches ***************** • Group B is silt loam or loam. It has a moderate infiltration rate when thoroughly wetted. Moderately deep to deep, moderately well to well drained soils with moderately fine to moderately coarse textures. Root Limiting / Impermeable e layers over 50 to 100 cm or 20 to 40 inches Group A- Well Drained
Group C and D • Group C soils are sandy clay loam. They have low infiltration rates when thoroughly wetted and consist chiefly of soils with a layer that impedes downward movement of water and soils with moderately fine to fine structure. Perched water table 100 to 150 cm or 40 to 60 inches; root limiting 20 to 40 inches. ***************** • Group D soils are clay loam, silty clay loam, sandy clay, silty clay or clay. They have very low infiltration rates when thoroughly wetted and consist chiefly of clay soils with a high swelling potential, soils with a permanent high water table, soils with a claypan or clay layer at or near the surface and shallow soils over nearly impervious material ( < 20 inches). Group D - Poorly DrainedHighest Runoff Potential
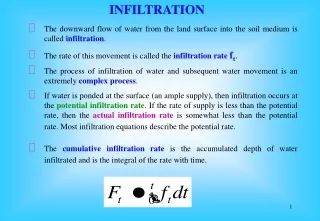
Definitions Infiltration - The downward entry of water into the immediate surface of soil or other materials. Infiltration Capacity- The maximum rate at which water can infiltrate into a soil under a given set of conditions. Infiltration Rate- The rate at which water penetrates the surface of the soil and expressed in cm/hr, mm/hr, or inches/hr. The rate of infiltration is limited by the capacity of the soil and rate at which water is applied to the surface. This is a volume flux of water flowing into the profile per unit of soil surface area (expressed as velocity). Percolation -Vertical and Lateral Movement of water through the soil by gravity.
Infiltration Rate and Capacity Soil Factors that Control Infiltration Rate: - Vegetative Cover, Root Development and Organic Content - Moisture Content - Soil Texture and Structure - Porosity and Permeability - Soil Bulk Density and Compaction - Slope, Landscape Position, Topography
Infiltration Rate (Time Dependent) Decreasing Infiltration Steady Gravity Induced Rate Infiltration with Time Rate is Initially High Because of a Combination of Capillary and Gravity Forces Final Infiltration Capacity(Equilibrium)- InfiltrationApproaches Saturated Permeability
Infiltration Rate (Moisture) Infiltration Decreases with Time1) Changes in Surface and Subsurface Conditions2) Change in Matrix Potential3) Overtime - Matrix Potential Decreases and Gravity ForcesDominate - Causing a Reduction in the Infiltration Rate
Measuring Infiltration Rate • Flooding (ring) Infiltrometers • Single ring • Double ring • Flooded Infiltrometers • Tension Infiltrometers • Rainfall-Runoff Plot Infiltrometers
Single Rings Infiltrometers Cylinder - 30 cm in DiameterDrive 5 cm or more into Soil Surface or HorizonWater is Ponded Above the Surface Record Volume of Water Added with Time to Maintain a Constant Head Measures a Combination of Horizontal and Vertical Flow
Double Rings Infiltrometers Outer Rings are 6 to 24 inches in Diameter (ASTM - 12 to 24 inches)Mariotte Bottles Can be Used to Maintain Constant HeadRings Driven - 5 cm to 6 inches in the Soil and if necessary sealed
Other Infiltrometers Ponded Infiltrometers Tension InfiltrometerUnsaturated Flow Of Water
Infiltration Rate by Soil Group/ Texture Source: Texas Council of Governments, 2003.
Infiltration Rate Function of Slope & Texture Source: Rainbird Corporation, derived from USDA Data
Infiltration Rate Function of Vegetation Source: Gray, D., “Principles of Hydrology”, 1973.
Comparison Infiltration to Percolation Testing Percolation Testing Over Estimated Infiltration Rate by 40 to over 400% Source: On-site Soils Testing Data, (Oram, B., 2003)
Case 1 :Myers Proposed Development Worcester Township, Pennsylvania • Abbottstown Silt Loam, Deep to Moderately Deep, Somewhat Poorly Drained • Some Areas Shallow Depth to Firm Bedrock • Signs of Erosion • Low Surface and Near Surface Infiltration Rates Associated with Surface Smearing, Btx, Bx Horizons • BC/ C /R Horizons Higher Infiltration Rate. • Readington Silt Loam • Deep Moderately Well Drained • Low Infiltration Surface, Bd, and Btx • High Infiltration in C and R Horizons
Infiltration Rate Function of Horizon A, B, Btx, Bt, C, RC/R Testing - Areas Fractured Rock Source: On-site Infiltration Testing - Mr. Brian Oram, PG (2003)
Case 2: Country View at SalfordSalford Township, Montgomery County, PA Soil –CrB2 – Croton Silt Loam Deep, Poorly Drained Diagnostic Features: Bx, Bxg, Bt, R (firm) Reported Infiltration Rate: < 0.2 to 2.0 in/hr Field Measured Rate: 0.1 to 0.52 in/hr Primary Natural Drainage: Depression Storage, Swale Development, Throughflow Flow Through Wetland Areas, Overland Flow Predevelopment Conditions: Unstable Stream Banks, Overland Flow from Off Site
Evaluation Infiltration • Step 1: Desktop Assessment - GIS • Review Published Data Related to Soils, Geology, Hydrology • Step 2: Characterize the Hydrological SettingWhere are the Discharge and Recharge Zones?What forms of Natural Infiltration or Depression Storage Occurs? • Step 3: On-Site Assessment • Deep Soil Testing Throughout Site Based on Soils and Geological Data • Double Ring Infiltration Testing • How will water move through the site ? • Step 4: Engineering Review and Evaluation • Step 5: Additional Infiltration or On-site Testing • Step 6: Final Design
Soils, Infiltration, and On-site Testing Presented by: Mr. Brian Oram, PG, PASEOWilkes UniversityGeoEnvironmental Sciences and Environmental Engineering DepartmentWilkes - Barre, PA 18766 570-408-4619 http://www.water-research.net
Horton Equation (1939) Infiltration is a Function of Time as defined by: f(t) = fc + (fo – fc)e^-kt f(t) = infiltration rate for any time “t” from beginning of infiltration fc = infiltration capacityfo = initial infiltration rate at (t=0) e = 2.71 =base of natural log k is a measure of the rate of decrease in infiltration rate(constant that depends on soil type) Large Watershed Application - Replaced by Philip and Green-AmptHorton Method Used in EPA Storm Water Management Model
Green-Ampt Equation • Green-Ampt model was the first physically-based model/equation describing the infiltration of water into soil. The model yields cumulative infiltration and the infiltration rate as an implicit function of time. The volume of infiltration was a function of: • Soil pores are saturated behind wetting front; • Wetting front moves in response to capillary forces; and • Darcy’s flow governs that headloss in the saturated zone. • Approx. Equation: f = (A/F)+B; f = infiltration rate, F - accumulative infiltration, and A and B are fitted parameters • The Green-Ampt Model has been modified to calculate water infiltration into non-uniform soils by several researchers . In 1989, GALAYER was developed for heterogenous soils • Models Available at: http://www.epa.gov/ada/csmos/ninflmod.htmlhttp://www.bae.ncsu.edu/soil_water/drainmod/dmversions.htm
Philip Equation (1960) where:F = total depth of infiltrated water in mm.t = time in seconds K = hydraulic conductivity in mm/sec m = the average moisture content of the soil to the depth of the wetting front m0 = initial soil moisture content - based on API calculation or inputPot = capillary potential at the wetting front in mm Pot = 250 log (K) + 100 D1 = depth of water on the soil surface Takes into account the “Ponding Head” Models Available at: http://www.epa.gov/ada/csmos/ninflmod.html
Soils, Infiltration, and On-site Testing Presented by: Mr. Brian Oram, PG, PASEOWilkes UniversityGeoEnvironmental Sciences and Environmental Engineering DepartmentWilkes - Barre, PA 18766 http://www.water-research.net


![SOILM – Percentage of soils with medium infiltration capacity [%]](https://cdn2.slideserve.com/4698308/slide1-dt.jpg)