Download
1 / 26
260 likes | 288 Vues
Explore hydrological impacts, land use changes, and water balance calculations within Gorai River Catchment in Bangladesh using SWAT model.

E N D
The Ganga Basin: Sub-basin Scale Water Resources Assessment International Water Management Institute (IWMI) Luna Bharati and Priyantha Jayakody
Water Availability and Access: Levelsof Analysis • Basin Scale Analysis • Monthly water balance using WEAP • Sub-basin Scale • Detailed water balance calculations using SWAT • Three sub-basins: Koshi, Upper Ganga and Gorai
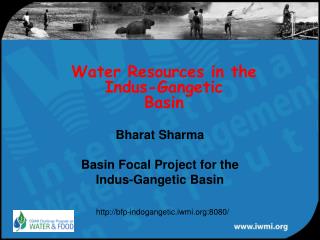
Hydrologic impacts of inflow and landuse change in the Gorai River Catchment, Bangladesh Main Objectives: • Study the effect of upstream water resource development and as well as the influence of land use change on the hydrology and water balance of the Gorai River Catchment
Gorai-River Catchment: Background • The Gorai river is the largest perennial distributor of the Ganges River in Bangladesh • Gorai River water supplies are crucial to the environmental and economic well being of the Southwest corner of Bangladesh which also includes the threatened Sundarbans mangrove forest • The freshwater supplies from the Gorai has been important to control salinity intrusion • Average annual rainfall varies between 1,516 mm in the Northeast and 2,478 mm in the Southeast
Gorai-River Catchment: Background • Bangaladesh claims that the dry season flow of the Gorai has drastically decreased since the operationalisation of the Farraka Barrage in India in 1975 • Water flow management of the Ganges basin at Farakka is the major dispute between India and Bangladesh
Gorai-River Catchment: Specific Objectives • Set up the Soil and Water Assessment Tool (SWAT) for the period from1969-1975 (Pre-Farakka) and 1990-1997 (Post Farakka) • Prepare two land use maps for the model from 1977 and 1997 • Calculate and compare water balances for the catchment for both periods (1969-1975 vs. 1990-1997) • Scenario analysis of different water management options
Methods: SWAT Model Description • The SWAT model is a river basin scale model developed to quantify the impact of land management practices in large complex watersheds • Conceptually, SWAT divides a watershed into sub-watersheds. Each sub watershed is connected through a stream channel and further divided in to Hydrologic Response Unit (HRU). • HRU is a unique combination of soil and vegetation type in a sub watershed, and SWAT simulates water balances, vegetation growth, and management practices at the HRU level. • Runoff is predicted separately for each HRU and routed to obtain the total runoff for the watershed.
Methods: Input Data • Spatial Data • Digital Elevation Model • Land Use Map • Soil Map and Soil Properties • River network • Time Series Data • Meteorological data ( Rainfall , Maximum and minimum Temperature, Relative humidity, Sunshine hours, Wind speed ) • Flow data
Gorai River Catchment • Loam soil : 55% of the basin • Sandy loam : 20% • Clay soil: 17% Figure 2. Soil types over the study area
Model Performance Evaluation Figure 1 : Observed and simulated flow during the calibration period for the 4th sub basin outlet. r2 is 0.96 Figure2 : Observed and simulated flow during the validation period for the 4th sub basin out let. r2is 0.94
Results: Land use change • 1977 Classified Land use map was obtained from the Bangladesh water development board and 1997 Land sat MSS image was downloaded and classified using the visual observation technique. Both the maps were re-sampled at 30m for direct comparison. • Comparison of both land use map shows: • 2% reduction in water bodies from 1977 to 1997 • Settlement area remains constant • Agriculture area including rice has increased from 52% to 80% from the total basin land extent • Forest area has decreased from 29% to 4% from 1977 to 1997
Figure 5: Average monthly inflow to the Gorai Catchment measured at Gorai railway-bridge
Water Balance Results Water balance at each sub basin during 1965 to 1975 (1 to 22 are sub basin numbers) Water balance at each sub basin during 1990 to 1997
Actual ET from the two time periods: • As expected, ET changes can be linked to the landuse changes in the catchment. • ET has decreased in Sub-basins where landcover has changed from Forest to Agriculture and increased where rice has replaced some of the traditional agricultural crops
Scenario Analysis Figs. Land use and inflow change effects on discharge
Upper Ganga Catchment, India • Basin Characteristics • The Upper Ganga sub-basin was delineated by using the 90m SRTM digital elevation map with Kanpur barrage as the outlet point • Total area is 87000 km2 • The elevation in the sub-basin ranges from 7500 m at upper the mountain region to 100 m in the lower plains • Rainfall in the sub-basin was found to range between 200 mm and 2200 mm
Upper Ganga Catchment, India Upper Ganga Landuse map 2003 FAO 95 Soil map for Upper Ganga basin • The Landuse map (2003)shows that 65% of the basin is occupied by agriculture. The main crop types are wheat, maize, rice, Sugarcane, Bajra and Potato. Around 25% of the land is covered by forests and mostly appears in the upper mountains. • There are eight soil types however, Eutric cambisols and Oluvisols are the main types and occupy around 60% of the sub-basin area
Upper Ganga Catchment, India • Basin Characteristics • The main river channel is highly regulated with dams, barrages and corresponding canal systems • The two main dams are the Tehri dam and the Ramganga dam. In this study however, only the Ram ganga dam was considered as the Tehri dam became operational after the study period (Study period is from 1995-2005). • There are three main canal systems. The Upper Ganga Canal (gross command area is about 2 million ha), the Madhya (178000) ha. and the Lower Ganga canal (0.5 million ha.) Major Water Resource Projects Source: INRM Consultants
Upper Ganga Catchment, India • Observed vs. Simulated discharges at Narora (r2 =0.88) Main constraint was the lack of met. stations in the upper mountain region as well as availability of a long time series of discharge data
Upper Ganga Catchment, India • Water balances from the sub-basins are affected by water regulation through the barrages, dams and canals • ET is found to be highest for the forested areas followed by irrigated areas
Koshi Sub-basin • Basin Characteristics • The area considered in this study is the Kosi Basin upstream of Chatara in the mountainous region of eastern Nepal and southern Tibet (54,000 km2) • The average elevation of the basin is 3,800 m but varies from 140 m at Chatara to more than 8,000 m in the Great Himalayan Range including Mt. Everest (8848 metres) • The sub-basin can be divided into the mountainous zone, Himalayan zone, and Tibetan Plateau. • Average annual precipitation ranges from 431mm to 2635mm SRTM 90m Digital Elevation model for the Koshi basin
Koshi Sub-basin Land use map for 1992/93 from AVHRR data Soil Map (FAO 95) • Forests and the pasture lands dominate the upper reaches while low land areas occupied for agriculture. The food crops are rice and maize but potato and millet are the staple food crops for the highland communities. Wheat is the major winter crop and the potato for the lower altitudes. • Major soil types in the basin are Lithosols in upper areas while Dystric cambisols are in lower elevation areas which is dominated by agriculture
Koshi Sub-basinDaily and monthly observed vs. Simulated discharges from the sub-basin outlet Daily Monthly
Koshi Sub-basin • Water Balance Results • Runoff exceeds evapotranspiration • The southern part of the basin is wetter than the trans-Himalayan northern part of the basin • Evapotranspiration is higher in the South than in the North