Download
1 / 25
380 likes | 888 Vues
flood Modelling of Kalu-Ganga river basin. H. K. Nandalal Department of Civil Engineering University of Peradeniya Peradeniya Sri Lanka. Introduction. Problems related to flooding have greatly increased over recent decades because of population growth

E N D
flood Modelling of Kalu-Ganga river basin H. K. Nandalal Department of Civil EngineeringUniversity of PeradeniyaPeradeniyaSri Lanka
Introduction • Problems related to flooding have greatly increased over recent decades because of • population growth • development of extensive infrastructures in close proximity to rivers • It is importance to find solutions by • utilizing modern technology like Geographic Information Systems (GIS), Remote Sensing (RS) and • flood modeling
Outline of the Presentation • Study area • Data used • Software used • Application of Software • HEC-HMS • HEC-RAS • ENVI
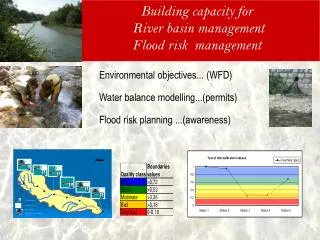
Study Area • Kalu-Ganga river basin in Sri Lanka • Total catchment area is 2719 km2 • Entire basin lies within the wet zone. • Average annual runoff is around 7600 MCM. • Catchment experiences average annual rainfall of 4000 mm.
Study Area • Study concentrates on the lower reaches of the river • Area of interest is nearly 500 km2 • This includes 5 Divisional Administrative Divisions (DSD)
Data used TIN Model of the Study area Contour Data LIDAR DATA
Data used Locations of rainfall and discharge gauging stations
Data used • Satellite images • Raw Images (Dry Date, 03 March,2008) ALOS – PALSAR (HH) • Raw Images (Wet Date, 03 June,2008) ALOS – PALSAR(HH)
Data used Data Collection and Data-basing…
Application of HEC-HMS Rainfall –Runoff Modeling
Application of HEC-HMS Basin model developed using HEC-GeoHMS
Application of HEC-HMS Results of the verification runs to compare the simulated flows and the observed flows of the calibrated HEC-HMS model
Application of HEC-RAS Flood Modeling
Application of HEC-RAS Geometric Data: HEC-GeoRASexport • Stream C/L • River banks • Flow paths
Application of HEC-RAS Discharge data obtained from HEC-HMS Mawakoya Elagawa Junction Mawakoya/Kalu Ganga Kuda Ganga Junction Kuda Ganga/Kalu Ganga
Application of HEC-RAS HEC-RAS output
Application of HEC-RAS HEC-RAS output
Application of HEC-RAS Flood Hazard Maps from HEC-RAS
Verification of model result by satellite data • Raw Images (Dry Date, 03 March,2008) ALOS – PALSAR (HH) • Raw Images (Wet Date, 03 June,2008) ALOS – PALSAR(HH)
Band Math Image (WET-DRY) (Difference dB image Wet - Dry) Mask
Comparison of the Flood extent derived from HEC-RAS model and Satellite image
Thank you for your patience. Questions?