Download
1 / 12
120 likes | 221 Vues
Explore the intriguing variability of the Crab Nebula in X-ray emissions from 2001-2010, noting spectral softening during flux declines and advances. Data from RXTE, Swift/BAT, and Fermi GBM revealed significant observations. The monitoring will continue with Fermi/GBM, MAXI, and Swift/BAT post-RXTE era.

E N D
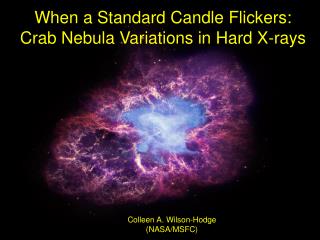
When a Standard Candle Flickers: Crab Nebula Variations in Hard X-rays Colleen A. Wilson-Hodge (NASA/MSFC)
Collaborators G.L. Case, M.L. Cherry (LSU), W.H. Baumgartner (NASA/CRESST), E. Beklen (METU/SDU), P.N Bhat, M.S. Briggs (UAH), A. Camero-Arranz (NSSTC), G.L. Case (LSU), V. Chaplin, V. Connaughton (UAH), M.H. Finger (USRA), N. Gehrels (NASA/GSFC), J. Greiner (MPE), K. Jahoda (NASA/GSFC), P. Jenke (NPP/NASA/MSFC), R.M. Kippen (LANL), C. Kouveliotou (NASA/MSFC), H. A. Krimm (CRESST/NASA/GSFC/USRA), E. Kuulkers (ESA/ESAC), C.A. Meegan (USRA), L. Natalucci (INAF-IASF), W.S. Paciesas (USRA), R. Preece (UAH), J.C. Rodi (LSU), N. Shaposhnikov, G.K. Skinner (UMD/CRESST/NASA/GSFC), D. Swartz (USRA), A. von Kienlin, R.Diehl, X. Zhang (MPE) MAXI data from http://maxi.riken.jp
The Crab Nebula 1999-2011 1999 2011 Wilson-Hodge et al. 2011, ApJ, 727, L40; Wilson-Hodge et al. 2011, PoS(HTRS 2011), 043 Light curves for each instrument are normalized to its average rate from MJD 54690-54790. RXTE/PCU2 - Black BAT - Red IBIS/ISGRI - Green JEM X2 - orange SPI - Light blue GBM - Blue squares Instruments on four separate spacecraft show ~7% decline in Crab (nebula+pulsar) flux from summer 2008 to summer 2010.
Each Individual observation fitted PCU2 layer 2&3 data Absorbed Power-law Nh fixed 0.971022 cm-2 Increase in spectral index Crab PCU2 Spectra
Averaged fit results in 100-day bins Colors denote “rising”, “declining” and “flat” intervals. Photon index softens from 2.15 to 2.17 during 2008-2010 flux decline 8-sigma effect RXTE PCA Spectra
Time Time Comparing “rising”, “declining”, and “flat” flux intervals • Photon index softened from 2.14 to 2.17 • Softening occurring in declining phases • Hardening during initial rise • Similar results in PCU 3 & 4
Evidence for Softening in Swift/BAT • Color scheme matches RXTE Softening during 2008-2010 decline • Earlier intervals consistent with constant hardness • Hardness ratios 14-50 keV/50-100 keV BAT 58-month survey data • 50-day averages
55297-55343 54690-54763 Spectral Softening in GBM • GBM 8-1000 keV Earth occultation measurements • Beginning and end of decline interval • Spectral index increases from 2.11(1) to 2.17(2)
Very active period 2001-2010 December 2011 flux is at or below level before 2001. Larger variations in 15-50 keV band 3 PCUs, layers 2&3 Count rates corrected for dead time and response RXTE Mission-long Light Curves <15keV 15-50 keV
Recent Data 2008-2012 <15 keV 15-50 keV
20-year Crab Nebula Light Curve 15-50 keV 50-100 keV
Summary & Conclusions • The Crab Nebula was surprisingly variable from 2001-2010, with less variability before 2001 and since mid-2010. • We presented evidence for spectral softening from RXTE, Swift/BAT, and Fermi GBM during the mid-2008-2010 flux decline. • We will miss RXTE, but will continue our monitoring program using Fermi/GBM, MAXI, and Swift/BAT. • Thank you RXTE team, especially Jean, Tod, Keith, Nikolai, Evan, & Divya!