Download
1 / 71
710 likes | 824 Vues
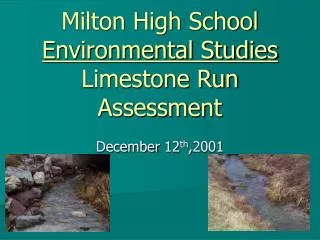
On December 12, 2001, Milton High School's Environmental Studies class assessed the Limestone Run watershed, covering 11.6 sq. miles and including a 10-mile stream. This report highlights significant environmental issues like erosion, sedimentation, and high nitrate levels, as well as the absence of riparian buffers. The class developed a 10-year rehabilitation plan to address these challenges, including goals for restoring fish populations and stream health. Funded by two key grants, the project emphasizes water quality monitoring and habitat restoration.

E N D
Milton High SchoolEnvironmental StudiesLimestone Run Assessment December 12th,2001
Environmental Studies Class • Gary Sassaman Dwight Eberhart • Chase Satteson Nate Chamberlin • Chris Buck Derek Rabuck • Josh Allen Chuck Coup • Matt Swallow Amanda Herman • Matt Orso Jason Shutt • Scott Coup • Ryan Kelchner • Randy Kramm • Levi Yoder
Limestone Run Watershed • The watershed is 11.6 sq. miles. • The stream is ten miles long. • Most of watershed is open agricultural land. • Routes 80 and 147 run through it and 254 parallels the creek.
Trout Unlimited’ s Description of Limestone Run “ This small stream has a mouth watering name but in reality it’s not at all appealing. There is limestone under the stream, and in some places there is the right aquatic weed ; however, this stream could be a case study titled “cattle and there effect.” There is no shade, the banks have been beaten down, it’s muddy, it is warm, and as it is now, has nothing to recommend it.”
Problems With Limestone Run • On the 303d list • Erosion and Sedimentation • High Nitrate Levels • Lack of Riparian Buffers
Past Activities • In 1991 the class started doing water testing. • From 1992-99 they continued doing watershed treatment. • Form 99-00 the class picked up the “Watershed Concept.” • In 99-00 the class also made it’s ten year plan.
Goals • Fish Return • Reduce Flooding • Reduce Sediment • Reduce Nutrients • Reduce Temp. • Repair Stream bank • Increase Dissolved Oxygen • Create A Riparian Buffer
Timeline • 1999-2000 Beginning if ten year plan. • 2000-2001 Coalition • 2001-2003 Assessment • 2006-2007 Trout Return • 2009-2010 Experimental Hatchery
Stream Hydraulics - Pattern - Dimension Profile
Pattern • The Sinuosity of the Creek.
Dimension • Cross Sectional Profile
Profile • Longitudinal Flow of Stream
Things that effect Pattern, Dimension and Profile. • Depth • Slope • Width • Velocity • Flow Resistance • Sediment Size • Sediment Load • Stream Discharge
Environmental StudiesBudget& Equipment By: Scott Coup, Ryan Kelchner,& Randy Kramm
Grants • The Environmental Studies class received two grants. • Growing Greener Grant • John G. Clark, Jr. Environmental Education Grant given by Merrill W. Linn Land and Waterways Conservancy
Grants • Growing Greener Grant • The Growing Greener Grant provides the Environmental Studies class with $23,920. • It is good for 2 years. - The Grant calls for us to access 8 miles of Limestone Run.
John G. Clark Jr. Environmental Educational Grant • The Linn Conservancy Grant of $486 provided funds to buy two tidbits and an optic shuttle. -The equipment will help the Environmental Studies class to collect data on the fluctuating water temperature of Limestone Run.
Budget for the GrowingGreener Grant 1. Sponsor Salaries/Benefits $1,300 2. Equipment and Supplies $11,620 3. Contractual $5,000 4. Construction (Stream bank fencing) $6,000 5. Total $23,920
Equipment • 1 Lap Top Computer $3,830.44 • 1 Digital Camcorder $892.59 • 1 Digital Camera $483.10 • 2 GPS/GIS Receivers $567.90 • 3 Hip Chains $218.00 • 2 100ft Tape Measure $59.50 • 1 300ft Tape Measure $39.95 • 4 Waders $210.00
Equipment/Continued • 4 Stowaway tidbits $396.00 • 1 Base Station/ Coupler Kit $70.00 • 1 Optic Shuttle $189.00 • 25 Safety Glasses $96.25 • 2 Armored Thermometer $19.00 • 2 (100/box) Latex Gloves $17.90 • 1 Boxcar 3.6 Starter Kit $14.00 • 2 Tuff Stuff Flagging Tape $3.20
Equipment/Continued • 1 Kick Net with poles $78.00 • 3 6” Forceps $11.97 • 1 24/pk Wide Storage Bottles $23.85 • 1 Sledge Hammer $12.90 • 2 Model BP3180(Pruners) $49.90 • 1 Model RL Horizontal Laser $1,200.00 • 1 Tripod $120.00 • 1 Grade Rod 10ths or inches $80.00
Equipment/Continued • 1 Sensor for Laser w/bracket $250.00 • ArcView GIS 3.2 $495.00 • Magellan GPS Map 330M $538.00 • Canon Camera & Accessories total $892.59
This is a list of all the basic tools and equipment that we use while out assessing Limestone Run.
Mapping • Uses • Equipment Used • Problems
Uses • Show Data • Future Comparison
Equipment • GPS • Hip Chains • ArcView
Problems • Programs Do Not Interface • Security Setting On school Computer
Longitudinal Profile Measurement -Chuck Coup -Amanda Herman -Randy Kramm -Ryan Kelchner
Cross Section of Stream Left Bank Right Bank TOP OF BANK BANKFULL WATERS EDGE THALWAG
Top of Bank Bankfull WaterLevel Bed Profile RIFFLE Longitudinal Profile POOL
Cross Sectional Profile • Scott Coup • Matt Swallow • Josh Allen
Procedures for Cross Section • Establish benchmarks on each side of the stream • Pound one piece of rebar in at each benchmark • Attach the tape measure to the rebar with spring clamps so that is stretches the width of the stream.
Level II Assessment -Cross Sections Takes accurate measurements of the dimension of the physical properties of the creek Cross Sections are used to find problems with the stream so we can repair the flaws
Limestone Run Restoration Project Pebble Count What do pebbles have to do with the stream? How the pebbles affect the stream.
Pebble Count • Pebbles affect the streams water speed. The rocks in the stream can either slow down the water speed or speed it up. The bigger the rocks the slower the water. This is because the rocks cause resistance of the current The smaller the rocks the faster the current can go. This is because the water has no resistance from rocks.
Pebble Count • The Pebbles also can fill up a stream bed which is a problem with some streams.
Pebble Count • The Process In a reach or part of a stream you go about every 100ft and measure 10 pebbles at the tip of you boot.
Pebble Count • The process /cont. When you pick up your first rock you measure the three longest axis of the pebble( length, height, width). Then you record those records.
Stream Bank Assessment Chris Buck and Matt Orso
Introductionto Stream Bank Assessment We used the U.S. Fish and Wildlife Service’s Stream and Riparian Habitats Rapid Assessment Protocol. The Protocol is a comprehensive stream assessment and inventory protocol which incorporates riparian corridor and stream stability assessments. The protocol is for use for us to rapidly identify, assess, and prioritize stream corridor conditions within a watershed. The assessment only provides a relative ranking rather than a quantitive evaluation of magnitudes of change. The information gained will give us an idea of the potential problems but not identify cause and effect relationships influenced by factors located outside the assessment area. To figure out the main problem and cause and effect we would need to complete a more detailed assessment.
The Two Main Assessment Sections • Stream stability Bank Height Root Depth Root Density Bank Angle Surface Protection Aggrading Stream Beds Degrading Stream Beds • Riparian an In stream Habitat Assessment Instream Cover Epifaunal Pool Variability Shading Water Appearance Nutrient Enrichment Bank Vegetation Riparian Vegetation Riparian Zone Nutrient Uptake Potential
Results RIHSSTOTAL 7 Springs Farm 34 9 43 Lidecker 43 44 87 Hoover 1 30 38 68 Cottner 58 48 106 Hoover 2 41 17 58
Results RIHSSTOTAL Robert Pfleegor 70 64 134 Davis Farm 62 65 127 James Farm 40 60 100 Catholic Pavilion 51/204 74 127 Woods to 147 Bridge 159/204 82 241
Chemical Testing • Alkalinity • Hardness • pH • Nitrates • Ammonia • Dissolved Oxygen • Dissolved Carbon Dioxide • Chloride • Silica
Alkalinity • Refers to the capability of water to neutralize acid. • Alkalinity comes from the calcium and magnesium in the stream. • Preferred Alkalinity of fresh water streams:100 - 200ppm • Our results between 150-220ppm out of the 6 sites we tested.