Download
1 / 17
170 likes | 302 Vues
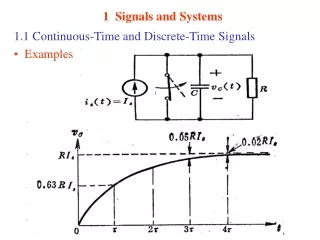
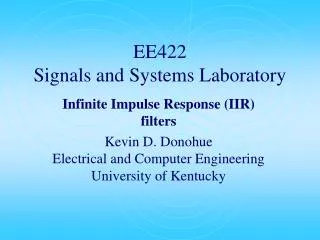
EE422 Signals and Systems Laboratory. Infinite Impulse Response (IIR) filters Kevin D. Donohue Electrical and Computer Engineering University of Kentucky. Filters. Filter are designed based on specifications given by: spectral magnitude emphasis

E N D
EE422Signals and Systems Laboratory Infinite Impulse Response (IIR) filters Kevin D. DonohueElectrical and Computer EngineeringUniversity of Kentucky
Filters Filter are designed based on specifications given by: • spectral magnitude emphasis • delay and phase properties through the group delay and phase spectrum • implementation and computational structures Matlab functions for filter design • (IIR) besself, butter, cheby1, cheby2, ellip, prony, stmcb • (FIR) fir1, fir2, kaiserord, firls, firpm, firpmord, fircls, fircls1, cremez • (Implementation) filter, filtfilt, dfilt • (Analysis) freqz, fdatool, sptool
Filter Specifications Example:Low-pass filter frequency response
Filter Specifications Example Low-pass filter frequency response (in dB)
Filter Specifications Example Low-pass filter frequency response (in dB) with ripple in both bands
Difference Equation and TF Examples • Derive the TFs for the following difference equations (y[n] is output and x[n] is input). (Hint: Use delay property of ZT and assume zero for initial conditions). Show Does this represent an FIR or IIR filter? What are the poles and zeros of this system?
Difference Equation and TF Examples • Derive the TFs for the following difference equations (y[n] is output and x[n] is input). (Hint: Use delay property of ZT and assume zero for initial conditions). Show Does this represent an FIR or IIR filter? What are the poles and zeros of this system?
Difference Equation and TF Examples • Derive the difference equation from the following TF (y[n] is output and x[n] is input). (Hint: Express in terms of negative z powers, use delay property of ZT and assume zero for initial conditions). • Show Is it stable? How would this be represented as direct form filter in Matlab?
Filter Specification Functions The transfer function magnitude or magnitude response: The transfer function phase or phase response: The group delay (envelope delay) :
Filter Analysis Example Consider a filter with transfer function: Compute and plot the magnitude response, phase response, and group delay. Note pole-zero diagram. What would be expected for the magnitude response?
Filter Analysis Example % Script to illustrate frequency analysis of filters % given y[n] = x[n-1] + 1.2728y[n-1] - 0.81y[n-2] fs = 8000; % Sampling frequency % Numerator and denominator polynomials to represent filter b = [0, 1]; % (numerator) first is element time of current output a = [1, -1.2728, 0.81]; % (denominator) first element is time of current output
Filter Analysis Example % Frequency response [h,f] = freqz(b,a,1024,fs); figure % Magnitude plot(f,abs(h)); xlabel('Hz'); ylabel('TF Magnitude'); figure % Phase plot(f,phase(h)); xlabel('Hz'); ylabel('TF Phase in Radians'); % Group delay [d,f] = grpdelay(b,a,1024,fs); figure % delay in seconds plot(f,d/fs); xlabel('Hz'); ylabel('delay in seconds'); figure % delay in samples plot(f,d); xlabel('Hz'); ylabel('delay in samples');
Filter Design Examples The following commands generate filter coefficients for basic low-pass, high-pass, band-pass, band-stop filters: • For linear phase FIR filters: fir1 • For non-linear phase IIR filter: besself, butter, cheby1, cheby2, ellip Example: With function fir1, design an FIR high-pass filter for signal sampled at 8 kHz with cutoff at 500 Hz. Use order 10 and order 50 and compare phase and magnitude spectra with freqz command. Use grpdelay to examine delay properties of the filter. Also use command filter to filter a frequency swept signal from 20 to 2000 Hz over 4 seconds with unit amplitude.
Filter Design Examples Example: With function cheby2 design an IIR Chebyshev Type II high-pass filter for signal sampled at 8 kHz with cutoff at 500 Hz, and stopband ripple of 30 dB down. Use order 5 and order 10 for comparing phase and magnitude spectra with freqz command. Use grpdelay to examine delay characteristics. Also use command filter to filter a frequency swept signal from 20 to 2000 Hz over 2 seconds with unit amplitude. Example: With function butter, design an IIR Butterworth band-pass filter for signal sampled at 20 MHz with a sharp passband from 3.5 MHz to 9MHz. Use order 5 and verify design of phase and magnitude spectra with freqz command.
z-1 z-1 z-1 z-1 G0 b0 b2 b1 -a2 -a1 x[n] y[n] w[n] 1/a0 Computational Diagrams For Direct form I filter below, derive difference equation and TF Hint: Form difference equations around accumulator/registeroutputs, convert to TF and try to cancel out auxiliary variables.
z-1 z-1 G0 y[n] w[n] x[n] 1/a0 b2 b1 b0 -a1 -a2 Computational Diagrams For Direct form II filter below, derive difference equation and TF Hint: Form difference equations around accumulator/registeroutputs, convert to TF and try to cancel out auxiliary variables.