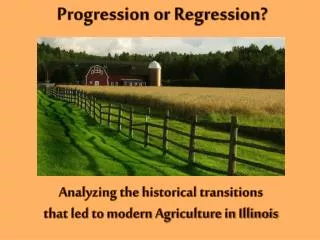
Progression or Regression?
Progression or Regression?. Analyzing the historical transitions that led to modern Agriculture in Illinois. Purpose. History will help us to conceptualize where we are at right now in order to decide where we might want agriculture to go in the future.

Progression or Regression?
E N D
Presentation Transcript
Progression or Regression? Analyzing the historical transitions that led to modern Agriculture in Illinois
Purpose • History will help us to conceptualize where we are at right now in order to decide where we might want agriculture to go in the future. • Modern agriculture has social, economic, and environmental implications that can be understood if we take a moment to look backward into the history of Illinois Agriculture.
Historical Transitions • Mechanization • Hybrid Corn • Introduction of Subsidies • Synthetic Inputs
Each Transition Has… • Definition • Facilitators • Benefiters • Unexpected Outcomes
Definition Definition: Replacing human labor with manufactured machinery to conduct agricultural practices in a more efficient and productive way. Low level of agricultural mechanization
History • Industrial Revolution of Late 1800s steam engine • 1920: 225 Tractors in the U.S. • 1930s=Constant Innovations • Internal combustion engine • Smaller more practical tractors • Rubber tires • Mounted plows • Mechanical cultivators • Accurate planters and drill
History • 1940: World War II creates farm productivity revolution • Self-propelled combines • Hydraulic power • PTO • Tractors are affordable and practical • 1945: 2.4 million tractors in U.S. http://www.livinghistoryfarm.org/index.html
Facilitation Who/what furthered agricultural mechanization? • Growing Demand for Food • Need higher farming efficiency • Inventions of Machinery • Abolishment of Slavery • World War II Agricultural Revolution • Research by Small Manufacturers • Research by Land Grant Universities • Development of More External Inputs • Corn hybrids • Fertilizers/pesticides
Benefits • For Farmers • Increased productivity of agricultural labor • Since 1948, have increased their productivity 1.8 percent each year • Reduced cost, horses could consume up to 20% of farmer’s crop in early 19th century
Benefits • For Consumers • Contributions to the economy • Lower food cost • Agricultural Machinery production employs 50,000, payroll of $8.5 billion • “the U.S. would have been almost ten percent poorer in 1955 in the absence of the farm tractor..…[it] has helped agriculture make a significant contribution to economic growth in the United States.” http://eh.net/encyclopedia/article/white.tractors.history.us
Benefits • For Implement Manufacturers • Almost 1,000 U.S. companies , many in Illinois • Today $32.7 billion agricultural machinery produced and sold in U.S. • Another $9.8 billion exported
Unexpected Outcomes • The persistence of soil compaction caused by machinery traffic has been reported by several scientists • “Compaction increases soil bulk density and penetration resistance and reduces macroporosity, aeration, infiltration and water storage in the soil.” • 2010: “Illinois Farmers Face Compacted Soils “ by Emerson Nafziger • Heavy equipment is the main cause of deep compaction
Unexpected Outcomes • Erosion from tillage practices • Application of chemicals • Pollution from use of fossil fuels
Unexpected Outcomes • Reduced number of horses and mules • Reduced number of mid-sized farms, many in Illinois
Corn-Hybrid Corn Impact on Illinois Ag • Most important crop in Illinois. • First mayor breakthroughs of science & knowledge applied to agriculture. • Catalyst effect on other revolutionary innovations and practices of the time. • The era of high yields and increased dependence on external inputs. • Corner stone of the development of the seed industry. • History, Facilitators, Importance, Benefiters & Unexpected Outcomes. http://en.wikipedia.org/wiki/Maize
History Mayor staple food for native Americans. Used in rotation with wheat, oats, barley and rye. Grain-Livestock operations. Open pollinated varieties were identified and selected by its appearance. Farmers used to improve their corn crop by selecting big ears with big kernels. “Show corn” decreased yield. http://en.wikipedia.org/wiki/Maize
Definition of Hybrid Corn http://www.mhhe.com/biosci/pae/botany/botany_map/articles/article_40.html http://en.wikipedia.org/wiki/File:GEM_corn.jpg
Facilitators U of I, Illinois experiment Station, Farmers, Private seeds men. Foundation of local Seed companies. Funk Tribred: First hybrid sold in Illinois in 1916. Hybrids weren’t very popular until after the 1930’s.
Hybrid Corn Adoption Between 1924 and 1959 hybrid adoption reached 95% of the corn acreage, yields overall increased from 27 bushels per acre to 47 bushels per acre. By 1990 corn production was 6 fold 1930 production. In 2009 Illinois corn growers planted 12 million acres to corn (53% of total land used in agriculture in the state) Illinois ranks 2 in corn production in the US (2100 million bushels 2009 crop) Source Agriculture Statistics NASS, Various Years
Benefiters Corn accounted for 62% of Illinois total crop marketing for 2008 estimated in $14.2 billion. Corn is one of the crops with highest input demand. In 2009 fertilizer (41%), seed (15%) and pesticides (9%) accounted for 65% of the total non land cost of production. http://www.agmrc.org/renewable_energy/ethanol/using_the_wind_to_fertilize_corn.cfm Source Agriculture Statistics USDA,NASS, Illinois Field Office
Unexpected Outcomes • In 2009, 20% of the Illinois corn crop was following corn. • Specialization=Monoculture • Total grain production is increased, farmers can expect yield reduction (7-10%) http://www.agweb.com/blog/Crop
Cropping systems vs. Monoculture Cropping systems: Monoculture: Increased risks of diseases, pests, Narrows strategies of weed management and control (weed resistance). Increased demand of inputs, fertilization, pesticides (higher costs). Increased risks of soil erosion. (soil without cover waiting for the next crop). Depend on one planting season/crop. • Prevent build up of patogens and pests. Less pressure on crop genetics. • Enables different strategies of weed management & control. • Balance fertility demanded by different crops avoiding nutrient depletion. • Maintains soil structure by alternating deep rooted and shallow rooted plants • More efficient use of resources, water, soil, radiation (more than one planting season). • Diversify production.
Agricultural Economic Revolution http://www.dailykos.com/story/2010/5/12/865270/-Farm-Subsidies,-Not-Sexy-But-Important
Definition • Subsidy - Monetary assistance granted by a government to a person or group in support of an enterprise regarded as being in the public interest. • Reasons for Agriculture: • Reduce Price Volatility • Increase Farm Income • Stabilize Food Stocks
Types of Disbursement • Direct Payment: $5 Billion • Marketing Loan: $1-7 Billion • Counter Cyclical payment : $1-4 Billion • Conservation Subsidy: $3 Billion • Insurance: $5 Billion • Disaster Aid: • Export Subsidy: $235 Million • Agricultural Research and Statistics: $3 Billion
Facilitators • 15 Government Administrations since 1910 • Herbert Hoover • Agricultural Credit Act • Agricultural Marketing Act • Franklin Delano Roosevelt • New Deal • Agricultural Adjustment Act http://en.wikipedia.org/
Agricultural Legislation • Federal Farm Loan Act of 1916 • Agricultural Marketing Act 1929* • Agricultural Adjustment Act of 1933* • Frazier–Lemke Farm Bankruptcy Act of 1934 • Bankhead-Jones Farm Tenant Act of 1937 • Agricultural Adjustment Act of 1938* • Agricultural Act of 1948 • Agricultural Act of 1949 • Agricultural Act of 1954 • Agricultural Act of 1956 • Farm Credit Act of 1971
“Farm Bills” • Food and Agricultural Act of 1965 • Agricultural Act of 1970 • Agricultural and Consumer Protection Act of 1973 • Food and Agriculture Act of 1977 • Agriculture and Food Act of 1981 • Food Security Act of 1985 • Food, Agriculture, Conservation, and Trade Act of 1990 • Federal Agriculture Improvement and Reform Act of 1996* • Farm Security and Rural Investment Act of 2002 • Food, Conservation, and Energy Act of 2008
Benefiters • Conceptually: • Small Farmers – Job Stability • Consumers – Food Supply Consistency • Nation – Political Strength • Reality: • Large Farms • Seed and Fertilizer Producers http://www.dailyyonder.com/speak-your-piece-farm-bill-rural-middle-class
Unexpected Outcomes • Technological Focus • Inaccurate Assistance • Shift in Cropping • Hindering of Global Trade http://www.newyorker.com/talk/financial/2008/11/24/081124ta_talk_surowiecki
Corporate Ag Subsidy Beneficiaries • Archer Daniels Midland: $36,305 • Boise Cascade Corporation: $11,024 • Caterpillar: $171,698 • Chevron: $260,223 • Deere & Company: $12,875 • DuPont: $188,732 • Georgia Pacific: $37,156 • International Paper: $375,393 • John Hancock Mutual Life Insurance: $125,975 • Mead Corp: $15,115 • Westvaco Corp: $268,740 http://www.organicconsumers.org/ofgu/subsidies.htm
Farm Income https://www.agronomy.org/publications/aj/articles/99/2/373
Inaccurate Assistance • “71 percent of farm subsidies go to the top 10 percent of subsidy beneficiaries, almost all of which are large farms. In 2002, 78 farms, none small or struggling, each received over a million dollars in subsidies. The bottom 80 percent of recipients average only $846 per year.” -Environmental Working Group-
Change in Cropping Reasons for the Shift • Safer Option • Infrastructure • Technology
Global Trade World Economic News 2003 • Yellow = Subsidies Paid by Rich Countries • Grey = Export Loss by Poor Countries • P1 = Price w/subsidies • P2 = Price w/o subsidies http://www.worldgameofeconomics.com/EconomicEvents2003.html
Illinois Subsidies http://www.project.org/info.php?recordID=307
Illinois Stats 1995 - 2009 Total Aid: $17.6 billion (’95-’09) • Farmer Averages: • 26% of Farmers received No Aid • Top 10% • $27,245/year • 67% of Total Disbursement = $10.2 Billion • Top 20 Individuals Received 3.4 - 7.2 Million • Bottom 80% • $819/year http://www.illinoisatlas.com/illinois/agriculture/agriculture2.htm
Illinois Stats 1995-2009 ProgramRecipientsTotal $ • Corn Subsidies 212,925 $11,479,463,527 • Soybean Subsidies 174,692 $3,413,938,891 • Conservation Reserve Program 76,715 $1,452,132,187 • Wheat Subsidies 111,119 $652,921,469 • Disaster Payments 46,963 $212,181,492 • Dairy Program Subsidies 3,245 $86,760,378 • Sorghum Subsidies 27,495 $80,363,229 • Env. Quality Incentive Program 6,963 $57,030,910 • Livestock Subsidies 22,241 $35,934,185 • Wetlands Reserve Program 176 $27,257,512 http://farm.ewg.org/region.php?fips=17000
Closing “I have no patience with those who claim that the present surplus of farm products means that we should stop our efforts at improved agricultural efficiency. What we need is not less science in farming, but more science in economics.... Science has no doubt made the surplus possible, but science is not responsible for our failure to distribute the fruits of labor equitably.” Henry A Wallace - “Father of Ag Subsidies”
Synthetic Inputs Definition: man made chemical pesticides and commercial fertilizers • Pesticides • Insecticides • Herbicides • Fertilizers • Nitrogen • Phosphorus
History of Herbicides (1000B.C.) • Greek poet Homer • “pest-averting” sulfur • Botanist Theophrastus 1000B.C. • Olive oil kills trees • Term coined in 1920s • Widespread use beginning in1940s Zimdahl 2010, Murray 2003
History of Pesticides • DDT 1939 • WWII • Atrazine 1959 • Degraded by microorganisms in small doses (Radosevich et al. 1994) • Roundup Ready 1973 • Non selective
Facilitators Researchers Journal Publishers Government
Researchers and Journal Publishers Edward H. Faulkner's Plowman's Folly, 1943 Agricultural researchers found funding by publishers (Zimdahl 2009) No-till practices can reduced erosion by 50% on average and 90% on peak (Langsdale 1979)
Government • USDA promoted no till through1985 and 1990 farm laws
Unexpected Outcomes Herbicide Resistance Killing of beneficial insects Groundwater contamination Eutrophication Nitrous Oxide Emission