Technology and Health Care Spending
150 likes | 313 Vues
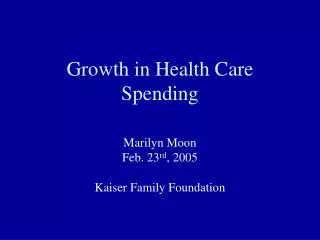
Technology and Health Care Spending. Bruce Steinwald February 5, 2008. Unsustainable Spending Trends How does technology manifest itself in health care spending Potential Congressional action. Growth in Health Care Spending: Health Care Spending as a Percentage of GDP. Percent. Year.

Technology and Health Care Spending
E N D
Presentation Transcript
Technology and Health Care Spending Bruce Steinwald February 5, 2008
Unsustainable Spending Trends How does technology manifest itself in health care spending Potential Congressional action
Growth in Health Care Spending: Health Care Spending as a Percentage of GDP Percent Year Source: The Centers for Medicare & Medicaid Services, Office of the Actuary. Notes: The figure for 2016 is projected. The most current data available on health care spending are for 2006.
Effect of Entitlements on Federal Budget: Assuming Discretionary Spending Grows with GDP After 2007 and All Expiring Tax Provisions are Extended Revenue Source: GAO’s January 2007 analysis.
Cumulative Growth in Health Care Spending Per Capita, Medical Inflation, GDP Per Capita, and General Inflation, 2000-2006 Cumulative percentage 46.68 28.91 26.69 17.07 Source: Bureau of Labor Statistics, The Centers for Medicare & Medicaid Services, Office of the Actuary, and the Bureau of Economic Analysis. Note: The most current data available on health care spending per capita are for 2006.
Changes in Volume and Intensity of Physician Services Provided per Medicare Beneficiary, April 2000 to April 2005 Source: GAO analysis of Medicare Part B claims data from CMS.
Differences in Services Provided by Level of Medicare Spending Percentage more services provided in highest Medicare-spending regions as compared to lowest Medicare-spending regions for select services for three chronic disease cohorts Source: Elliot S. Fisher, David E. Wennberg, et. al, “The Implications of Regional Variations in Medicare Spending. Part 1: The Content, Quality, and Accessibility of Care,” Annals of Internal Medicine, vol.138, no.4 (February 2003).
Diagnostic Technology Advances Subject to Multiplier Effect • Diffusion of Dx Technology leads to … • More Diseases/Conditions Diagnosed, leading to … • More Treatment, which results in … • More Spending on both Dx and Tx
Sources of Information on Health Care Reform • Presidential Candidates’ Proposals • President’s 2009 Budget • Non-governmental Organizations (e.g., Commonwealth’s “Bending the Curve,” (12/2007) • Potential Congressional Actions (e.g., CHAMP, Summer 2007)
Congressional Action Driven By… • Faith-Based Beliefs (e.g., IT, CE, Consumerism) • The Need to Fix Medicare’s Sustainable Growth Rate (SGR) Problem
Near Term Congressional Action on Medicare • Replace SGR with Differential Fee Updates • Adjust Relative Prices in Medicare’s RBRVS • Expand Bundled Payments • Physician Profiling and Feedback
Long Term: What Can We Afford? Trend: Real GDP + 2.5% … Unsustainable SGR Standard: Real GDP + 0 % … Unacceptable Medicare Trustees: Real GDP + 1% …Reasonable?