Download

1 / 22
220 likes | 478 Vues
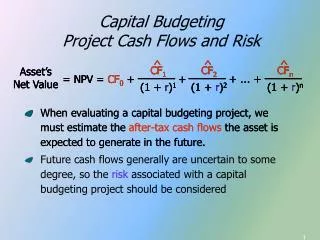
Chapter 7 Project Cash Flows and Risk. The cash flow estimation. Cash Flow from Assets. Cash Flow From Assets (CFFA) = Cash Flow to Creditors + Cash Flow to Stockholders Cash Flow From Assets = Operating Cash Flow – Net Capital Spending – Changes in NWC. Basic Terminology.

E N D
Chapter 7 Project Cash Flows and Risk
Cash Flow from Assets • Cash Flow From Assets (CFFA) = Cash Flow to Creditors + Cash Flow to Stockholders • Cash Flow From Assets = Operating Cash Flow – Net Capital Spending – Changes in NWC
Basic Terminology Conventional Versus Nonconventional Cash Flows
The Relevant Cash Flows • Incremental cash flows: • are cash flows specifically associated with the investment, and • their effect on the firms other investments (both positive and negative) must also be considered. For example, if a day-care center decides to open another facility, the impact of customers who decide to move from one facility to the new facility must be considered.
Relevant Cash Flows Major Cash Flow Components
Relevant Cash Flows • Categories of Cash Flows: • Initial Cash Flows are cash flows resulting initially from the project. These are typically net negative outflows. • Operating Cash Flows are the cash flows generated by the project during its operation. These cash flows typically net positive cash flows. • Terminal Cash Flows result from the disposition of the project. These are typically positive net cash flows.
Relevant Cash Flows Expansion Versus Replacement Cash Flows • Estimating incremental cash flows is relatively straightforward in the case of expansion projects, but not so in the case of replacement projects. • With replacement projects, incremental cash flows must be computed by subtracting existing project cash flows from those expected from the new project.
Relevant Cash Flows Expansion Versus Replacement Cash Flows
Relevant Cash Flows Sunk Costs Versus Opportunity Costs • Note that cash outlays already made (sunk costs) are irrelevant to the decision process. • However, opportunity costs, which are cash flows that could be realized from the best alternative use of the asset, are relevant.
Expansion Project—Example Increase production by adding a machine • Purchase price $(47,000) • Installation $(3,000) • Life 3 years • Salvage $5,000 • Increase in net WC $(1,500) • Increase in gross profit $21,000 • Marginal tax rate 34% • Depreciation method MACRS Increase production by adding a machine • Purchase price $(47,000) • Installation $(3,000) • Life 3 years • Salvage $5,000 • Increase in net WC $(1,500) • Increase in gross profit $21,000 • Marginal tax rate 34% • Depreciation method MACRS Increase production by adding a machine • Purchase price $(47,000) • Installation $(3,000) • Life 3 years • Salvage $5,000 • Increase in net WC $(1,500) • Increase in gross profit $21,000 • Marginal tax rate 34% • Depreciation method MACRS Increase production by adding a machine • Purchase price $(47,000) • Installation $(3,000) • Life 3 years • Salvage $5,000 • Increase in net WC $(1,500) • Increase in gross profit $21,000 • Marginal tax rate 34% • Depreciation method MACRS Increase production by adding a machine • Purchase price $(47,000) • Installation $(3,000) • Life 3 years • Salvage $5,000 • Increase in net WC $(1,500) • Increase in gross profit $21,000 • Marginal tax rate 34% • Depreciation method MACRS Increase production by adding a machine • Purchase price $(47,000) • Installation $(3,000) • Life 3 years • Salvage $5,000 • Increase in net WC $(1,500) • Increase in gross profit $21,000 • Marginal tax rate 34% • Depreciation method MACRS Increase production by adding a machine • Purchase price $(47,000) • Installation $(3,000) • Life 3 years • Salvage $5,000 • Increase in net WC $(1,500) • Increase in gross profit $21,000 • Marginal tax rate 34% • Depreciation method MACRS Increase production by adding a machine • Purchase price $(47,000) • Installation $(3,000) • Life 3 years • Salvage $5,000 • Increase in net WC $(1,500) • Increase in gross profit $21,000 • Marginal tax rate 34% • Depreciation method MACRS Increase production by adding a machine • Purchase price $(47,000) • Installation $(3,000) • Life 3 years • Salvage $5,000 • Increase in net WC $(1,500) • Increase in gross profit $21,000 • Marginal tax rate 34%* • Depreciation method MACRS Increase production by adding a machine • Purchase price $(47,000) • Installation $(3,000) • Life 3 years • Salvage $5,000 • Increase in net WC $(1,500)* • Increase in gross profit $21,000 • Marginal tax rate 34%* • Depreciation method MACRS
MACRS Depreciation Life Class of Investment Year3-year5-year7-year 1 33% 20% 14% 2 45 32 25 3 15 19 17 4 7 12 13 5 11 9 6 6 9 7 9 8 4 100% 100% 100%
Expansion Project—Initial Investment Outlay Purchase Price $(47,000) Installation ( 3,000) Δ Net WC ( 1,500) Initial invest outlay $(51,500) Depreciable basis = $47,000 + $3,000 = $50,000
Expansion Project—Incremental Operating Cash Flows Year 1 Year 2 Year 3 D gross profit $21,000 $21,000 $21,000 Depreciation (16,500) (22,500)( 7,500) Δ taxable income 4,500 ( 1,500) 13,500 Δ taxes (34%) (1,530)510( 4,590) Δ net income 2,970 ( 990) 8,910 Depreciation 16,50022,500 7,500 Δ operating CF 19,470 21,510 16,410 Depreciation1 = $50,000(0.33) = $16,500 Depreciation2 = $50,000(0.45) = $22,500 Depreciation3 = $50,000(0.15) = $ 7,500
Expansion Project—Terminal Cash Flow Salvage of asset $5,000 • Taxes on sale (510) • Δ net working capital 1,500 • Terminal cash flow 5,990
0 1 2 3 Expansion Project—Cash Flow Time Line 12% (51,500.00) 19,470 21,510 16,410 5,990 17,383.93 22,400 17,147.64 15,943.88 (1,024.55) IRR = 10.9%
Capital Budgeting Project Evaluation • Expansion projects—marginal cash flows include all cash flows associated with adding a new asset to grow the firm.
Corporate (Within-Firm) Risk • Determine how a capital budgeting project is related to the existing assets of the firm. • If the firm wants to diversify its risk, it will try to invest in projects that are negatively related (or have little relationship) to the existing assets. • If a firm can reduce its overall risk, then it generally becomes more stable and its required rate of return decreases.
Beta (Market) Risk • Theoretically any asset has a beta,, or some way to measure its systematic risk • If we can determine the beta of an asset, then we can use the capital asset pricing model, CAPM, to compute its required rate of return as follows: kproj = kRF + (kM - kRF)proj • Measuring beta risk for a project—it is difficult to determine the beta for a project. • pure play method
Beta (Market) Risk—Example • Capital Budgeting Project Characteristics: • Cost = $100,000 • bproject = 1.5 • kRF = 3.0% • kM = 9.0% • kproject = 3.0% + (9.0% - 3.0%)1.5 = 12.0% • Firm’s Characteristics Before Purchasing the Project: • Total assets = $400,000 • bfirm = 1.0 • Firm’s Beta Coefficient After Purchasing the Project: • Total assets = $400,000 + $100,000 = $500,000
Capital Budgeting—Risk Analysis • The firm generally uses its average required rate of return to evaluate projects with average risk. • The average required rate of return is adjusted to evaluate projects with above-average or below-average risks. Project Required Risk Category Rate of Return Above-average 16% Average 12 Below-average 10 • If risk is not considered, high-risk projects might be accepted when they should be rejected and low-risk projects might be rejected when they should be accepted.