Breakthrough: Smaller Limit on Electron's Electric Dipole Moment
10 likes | 88 Vues
Report on a 12x improvement in eEDM limit by ACME Collaboration, with values and errors provided as well as experimental details and systematic errors.

Breakthrough: Smaller Limit on Electron's Electric Dipole Moment
E N D
Presentation Transcript
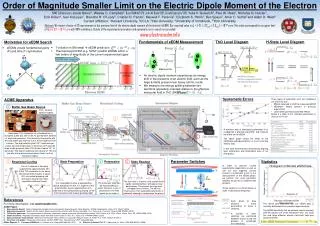
Order of Magnitude Smaller Limit on the Electric Dipole Moment of the Electron ACME Collaboration:Jacob Baron1, Wesley C. Campbell2, David DeMille3 (PI), John M. Doyle1 (PI), Gerald Gabrielse1(PI),YuliaV. Gurevich3, Paul W. Hess1, Nicholas R. Hutzler1, Emil Kirilov4, Ivan Kozyryev1, Brendon R. O’Leary3, Cristian D. Panda1, Maxwell F. Parsons1, Elizabeth S. Petrik1, Ben Spaun1, Amar C. Vutha5 and Adam D. West3 Current affiliation: 1Harvard University, 2UCLA, 3Yale University, 4University of Innsbruck, 5York University Abstract: We report a factor of 12 improvement on the previous limit of the electric dipole moment of the electron (eEDM). Our reported value is de = (-2.1 ± 3.7stat ± 2.5syst) ×10-29 e cm. This value corresponds to an upper limit of |de|<8.7 × 10⁻²⁹ e cm with 90% confidence. Details of the experimental procedure and systematic error search are provided. www.electronedm.info e- e- ThO Level Diagram Fundamentals of eEDM Measurement H-State Level Diagram Motivation for eEDM Search • T-violation in SM small eEDM prediction • Theories beyond SM (e.g. SUSY) predict eEDMs within a few orders of magnitude of the current experimental upper bound • eEDMs violate fundamental parity (P) and time (T) symmetries EDM state O • An electric dipole moment experiences an energy shift in the presence of an electric field, such as the large E-fields present near heavy atomic nuclei • We measure the energy splitting between two electrons oppositely oriented relative to the effective molecular field in ThO (84 GV/cm): + + Measure this Th P T Systematic Errors ACME Apparatus • Three types of systematic error are included in our final error bar: • Effects observed to shift the measured eEDM • eEDM-like effects present in previous experiments • Laser beam pointing associated effects • Below is a table of the included systematics in units of 10-29 e cm 1 0.75 in. 2 1 Buffer Gas Beam Source ThO2 ceramic ablation targets 4 K • A common way of identifying systematics is to exaggerate a physical parameter and measure the effect on the eEDM. • The above graph shows the effect on the eEDM-associated precession of a non-reversing electric field. • In this case the effect was minimized by aligning laser polarization with birefringent axes of our field plates. 16 K 9 cm Beamline 4 3 5 Neon flow line Ablation window • Gas-phase ThO molecules are introduced into a cryogenic buffer gas cell via 50 Hz pulsed laser ablation of a ceramic precursor. The molecules thermalize with the cold buffer gas and flow out of the cell aperture into a beam. The high ablation yield (1013 molecules per pulse) and low temperature of the beam (4 K) provide large single-quantum-state ThO fluxes of about 1011 sr-1 per pulse. The beam’s relatively low velocity of 170 m/s permits a long phase accumulation time in a short interaction region. Parameter Switches Statistics 5 State Preparation Precession 3 4 2 Rotational Cooling State Readout • In order to perform routine experimental diagnostics as well as rule out and suppress various sources of systematic errors in our measurement of the eEDM phase, we perform four main parameter switches as part of our experimental protocol. • These switches are shown below in order of decreasing frequency: • The J=1 sublevel is thermally populated by approximately 30% of the ThO molecules in our beam. We enhance this fraction to about 40% via optical pumping and microwave mixing from other populated rotational levels. • The final state is read out using a probe beam rapidly switched between orthogonal linear polarizations. This projects the state onto orthogonal basis vectors. The 690 nm fluorescence from each probe polarization is collected, allowing us to determine the phase. • The metastable H-state is populated by optical pumping from the J=1 sublevel of the ground state. A pure superposition of mJ sublevels is then prepared by pumping on the HC transition with linearly polarized light. • The initial spin state can be represented by a vector along the x-axis. It precessesin the field region by an angle f. • Gaussian fit References • Each block of data contains every permutation of these 4 switches. • A number of other switches are performed between blocks to aid the process of systematic error checking. • For more information, visit electronedm.info. • ACME Papers • Experimental Result: “Order of Magnitude Smaller Limit on the Electric Dipole Moment of the Electron.” ACME Collaboration. ArXiv:1310.7534v2 (2013). • Experiment proposal: “Search for the electric dipole moment of the electron with thorium monoxide.” A.C. Vuthaet al. Journal of Physics B 43, 074007 (2010). • ThO buffer gas beam: “A cryogenic beam of refractory, chemically reactive molecules with expansion cooling.” N.R. Hutzler et al. Phys. Chem. Chem. Phys. 13, 18976-18985 (2011). • Dipole moments: “Magnetic and electric dipole moments of the H state of ThO.” A.C. Vutha et al. PRA84, 034052 (2011). • Spin precession measurement: “Shot-noise-limited spin measurements in a pulsed molecular beam.” E. Kirilov et al. ArXiv:1305.2179 (2013). • Overview and update: “Advanced cold molecule electron EDM.” W.C. Campbell et al. EJP, to be published. • Other Papers: 7. Previous eEDM limit: J.J. Hudson et al. Nature473 493-496 (2011). 8. Effective E-field of ThO: E.L. Meyer and J.L. Bohn. PRA78 01052(R) (2008). • The above plot illustrates that our eEDM data is normally distributed to an excellent approximation. • The eEDM sensitivity that we achieve scales inversely with the square root of the integration time. Our large flux and large effective electric field both help give good sensitivity. • Histogram of Blinded eEDM Data • Number of Measurements • T-Statistic of Blinded eEDM Measurements