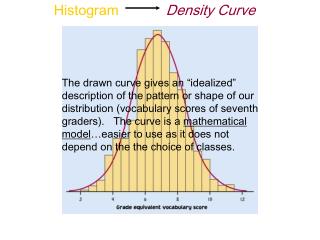
Histogram
Histogram. By: Amy Domenick, Rachael Dorn, and Lauren Burkert. About a Histogram . A histogram is a graphical display of data using bars that are different heights. It groups numbers into ranges. . About a Histogram . When do you use this graph?


Histogram
E N D
Presentation Transcript
Histogram By: Amy Domenick, Rachael Dorn, and Lauren Burkert
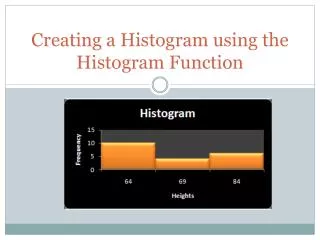
About a Histogram • A histogram is a graphical display of data using bars that are different heights. It groups numbers into ranges.
About a Histogram When do you use this graph? • To show continuous data (which is data that represents measured quantity) or grouped numerical data • Some examples are: weight, height, how much time
Data Needed • Numerical data: Observations or values that can be measured • Single set of data *You can use 2 sets of data
Data in Excel The frequency shows how many times the number occurs
What this graph means? • This histogram shows that on the night of 2/10/14 most people in the class got 7- 7.9 hours of sleep. This is less than the recommended hours (81/2 – 9+) of sleep we should be getting each night. It also shows that almost 70% of us got less than the recommended hours.
Quiz Problem • How many people got the recommended sleep hours for teens? (81/2 - 9+) • How many pieces of data are used in the graph?
Answers • 7 people • 23
How to make this graph? • http://youtu.be/mqF8isv6qAA
Advantages • It is easy to read and comprehend the data in the graph. • It shows continuous data.
Disadvantages • Not that many people know how to make and/or use a histogram. • You cannot read exact values because the numbers are grouped together.
Sources • http://kidshealth.org/teen/your_body/take_care/how_much_sleep.html • http://mathcentral.uregina.ca/QQ/database/QQ.09.99/raeluck1.html • http://www.mathsisfun.com/data/histograms.html • http://www.stat.berkeley.edu/~bradluen/stat2/lecture4.pdf • http://minney.org/book/export/html/102