Reading a Histogram
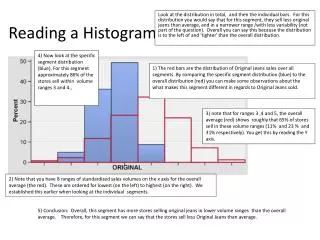
Reading a Histogram . 4) Now look at the specific segment distribution ( blue). For this segment approximately 86 % of the stores sell within volume ranges 3 and 4., .

Reading a Histogram
E N D
Presentation Transcript
Reading a Histogram 4) Now look at the specific segment distribution (blue). For this segment approximately 86% of the stores sell within volume ranges 3 and 4., Look at the distribution in total, and then the individual bars. For this distribution you would say that for this segment, they sell less original jeans than average, and in a narrower range /with less variability (not part of the question). Overall you can say this because the distribution is to the left of and 'tighter' than the overall distribution. 1) The red bars are the distribution of Original Jeans sales over all segments. By comparing the specific segment distribution (blue) to the overall distribution (red) you can make some observations about the what makes this segment differentin regards to Original Jeans sold. 3) note that for ranges 3 ,4 and 5, the overall average (red) shows roughly that 65% of stores sell in these volume ranges (11% and 23 % and 31% respectively). You get this by reading the Y axis. 2) Note that you have 8 ranges of standardized sales volumes on the x axis for the overall average (the red). These are ordered for lowest (on the left) to highest (on the right). We established this earlier when looking at the individual segments. 5) Conclusion: Overall, this segment has more stores selling original jeans in lower volume ranges than the overall average. Therefore, for this segment we can say that the stores sell less Original Jeans than average.