NIR SPECTROSCOPY: AN ADVANCED ALTERNATIVE
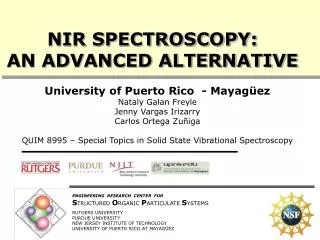
NIR SPECTROSCOPY: AN ADVANCED ALTERNATIVE. University of Puerto Rico - Mayagüez Nataly Galan Freyle Jenny Vargas Irizarry Carlos Ortega Zuñiga QUIM 8995 – Special Topics in Solid State Vibrational Spectroscopy. Electromagnetic spectrum. INFRARED. X-RAY 0,2 nm. ULTRA-VIOLET 2 nm.

NIR SPECTROSCOPY: AN ADVANCED ALTERNATIVE
E N D
Presentation Transcript
NIR SPECTROSCOPY: AN ADVANCED ALTERNATIVE University of Puerto Rico - Mayagüez Nataly Galan Freyle Jenny Vargas Irizarry Carlos Ortega Zuñiga QUIM 8995 – Special Topics in Solid State Vibrational Spectroscopy
Electromagneticspectrum INFRARED X-RAY 0,2 nm ULTRA-VIOLET 2 nm VISIBLE 400-800 nm MICROVAWE 3 mm-20 cm RADIO 10 m-30 Km NEAR MID FAR ʎ, cm (wavelength) 7.8x10⁻⁵ to 3x10⁻⁴ 3x10⁻⁴ to 3x10⁻³ 3x10⁻³ to 3x10⁻² ʎ, cm-1 (wavenumber) 12820 to 4000 4000 to 400 400 to 33
Visualize bonds between atoms as springs The classical physics considers the atoms as particles with a given mass in the IR absorption process, and the vibrations of diatomic molecule described as follows (e.g., HCl): equilibrium bond length Spring force stretched Spring force compressed Mechanical model of a vibrating diatomic molecule Courtesy Bruker Optics
Modes of vibrations antisymmetric symmetric R R H H stretching R H R H R R H H in-plane bending R H R H scissoring rocking R R H H R H R H bending
Far-IR • The region below 400 cm-1, is now generally classified as the far infrared, characterized by low frequency vibrations typically assigned to low energy deformation vibrations and the fundamental stretching modes of heavy atoms. There is only one IR-active fundamental vibration that extends beyond 4000 cm-1, and that is the H-F stretching mode of hydrogen fluoride. J. Coates, “Vibrational Spectroscopy: Instrumentation for Infrared and Raman Spectroscopy”, Applied Spectroscopy Reviews, 1998, 33(4), 267 – 425.
Mid-IR • Today, the mid-infrared region is normally defined as the frequency range of 4000 cm-l to 400 cm-1. The upper limit is more or less arbitrary, and was originally chosen as a practical limit based on the performance characteristics of early instruments. The lower limit, in many cases, is defined by a specific optical component, such as, a beamsplitter with a potassium bromide (KBr) substrate, which has a natural transmission cut-off just below 400 cm-1. J. Coates, “Vibrational Spectroscopy: Instrumentation for Infrared and Raman Spectroscopy”, Applied Spectroscopy Reviews, 1998, 33(4), 267 – 425.
Near-IR • The original NIR work was with extended UV-Vis spectrometers. • Indicates that mid and NIR should be considered the same field. The NIR overtones are derived from the fundamental bands observed in the mid-IR. Mid-IR also has a number of overtones. Furthermore he states, “To strengthen this position, it must be realized that more than half of the mid-infrared spectrum contains overtones and combination frequencies of fundamental absorptions occurring below 2000 cm-1.” J. Coates, “Vibrational Spectroscopy: Instrumentation for Infrared and Raman Spectroscopy”, Applied Spectroscopy Reviews, 1998, 33(4), 267 – 425.
NIR past and present The history of near infrared (NIR) begins in 1800 with Frederick William Herschel. He was trying filters to observe sun spots and when he used a red one, he noticed that a lot of heat was produced, which was of a higher temperature than the visible spectrum. After further studying, he concluded that there must be an invisible form of light beyond the visible spectrum. http://coolcosmos.ipac.caltech.edu/cosmic_classroom/ir_tutorial/discovery.html
NIR past and present MIR NIR DIFFICULT? MIR spectra obtained by ATR and NIR spectra obtined by Diffuse Reflectance NIR spectroscopy was neglected by spectroscopist who, for long time, could not find any additional atractive information in that spectral region which was occuped by broad, superimposed and weak absortion bands (see reference 1).
NIR past and present Why NIR now? • Opticalfibers • 2. Computing power • 3. Chemometrics • 4. Interest in proccesanalysis Improvements in the fields of
Advantagesof NIRS Sample preparation is not required leading to significant reductions in analysis time. Waste and reagents are minimized (non-destructive testing). Online for process applications
Advantagesof NIRS Excellent analytical method for the study of solids. (For example, in the analysis of minerals) Lepidolite rock
Advantagesof NIRS Spectra may be obtained in non-invasive manner. Totally non-invasive analysis of blood glucose by NIR
Advantagesof NIRS Remote sampling is possible (good for hazardous materials). Source Detector By Raúl E. Gómez Perez, MS, 2000
Advantagesof NIRS NIR allows us to create calibration models for predicting concentrations of the pharmaceutical industry in real time (during the manufacturing process) * - M. Blanco, J. Coello, A. Eustaquio, H Iturriaga, and S. Maspoch, Development and Validation of a Method for the Analysis of a Pharmaceutical Preparation by Near-Infrared Diffuse Reflectance Spectroscopy, Journal of Pharmaceutical Sciences, 1999, 88(5), 551 – 556.
Advantagesof NIRS Milled sugar Granular sugar Possibility of using it in a wide range of applications (physical and chemical), and viewing relationships difficult to observe by other means.
Applications of NIR to pharmaceutical analysis Identification Testing of Raw Materials and Finished Products. Determination of Water Content. Determination of Particle Size Drug Content in Tablets and Powder Mixtures. Evaluation of Blend Uniformity (in-line monitoring) Thickness of Film Coating. Quantitating and tracking polymorphic changes during pharmaceutical processing.
Disadvantagesof NIR • Overlapping bands (combination), not easy to interpret. • Differences in spectra are often very subtle. • Usually not for trace level analysis.
Basic Principles of Vibrational Spectroscopy Raman Near-Infrared Mid-Infrared V V V Scattering technique Absorption technique n=3 n=3 Stokes Anti-Stokes n=2 n=2 n=1 n=1 n=0 n=0 r r r Fundamentals 4000 – 50 cm-1 Fundamentals 4000 – 200 cm-1 Overtones-Combinations 12500 – 4000 cm-1 Source Monochromatic radiation Laser VIS - NIR Source (Dispersed) Polychromatic radiation Globular tungsten
Mid Infrared Spectroscopy and Near Infrared Spectroscopy MIR alkanes. NIR alkanes. Observationss • The intensities of absorption bands decrease from the MIR to the vis. • The most intense MIR absorptions = polar groups. • Overtones and combination bands in the NIR are fundamental bands in the MIR. • The wavenumber positions of the overtones stray with increasing multiplicity from the exact multiples of their fundamentals due to the anharmonicity of the vibrations.
The Absorption Techniques of MIR and NIR Spectroscopy The Harmonic Oscillator The simplest classical model employed to have a didactic insight on the interaction of radiation and matter in the NIR spectral region depicts a diatomic molecule as two spherical masses (m1 and m2) connected with a spring with a given force constant (k). Hook´s law states that the energy (E) of this system is given by: E = (h/2π)√(k/µ) where μ is the reduced mass. V -A 0 +A The molecular vibration can be described by a simplified model supposing a harmonic oscillator for which the potential energy (V), as a function of the displacement of the atoms (x), is given by: V = ½ kx2 The potential energy curve of such an oscillator is parabolic in shape and symmetrical about the equilibrium bond length. +A -A 0 Displacement Harmonic Oscillator prepared by Carlos Ortega
The Absorption Techniques of MIR and NIR Spectroscopy For the harmonic oscillator the energy levels are equidistant and transitions are only allowed between neighboring energy levels with: Δn = ±1 According to the Boltzmann distribution, most molecules at room temperature populate the ground level n = 0, and consequently the allowed, so-called fundamental, transitions between n = 0 and n = 1 dominate the vibrational absorption spectrum. For the harmonic oscillator Δn = ±1 and Ep = hv, which matches the predicted equal energy difference between one state and the other of immediately higher energy. The figure at right shows the effect of photon absorption on the energy and amplitude of vibration.
The Absorption Techniques of MIR and NIR Spectroscopy A quantum mechanical treatment by the Schrödinger equation shows that the vibrational energy has only certain discrete values that are energy levels are expressed in wave number units (cm−1) given by: where h is Planck’s constant, ν0 is the vibrational frequency defined above and n is the vibrational quantum number that can only have integer values 0, 1, 2, 3, ... and so on. And c is the speed of light and .ν-0 is the wave number corresponding to the frequency ν0. Interaction of infrared radiation with a vibrating molecule, however, is only possible if the electric vector of the radiation oscillates with the same frequency as the molecular dipole moment, μ. The requirement of a dipole moment change during the vibration makes MIR spectroscopy specifically sensitive to polar funcionalities.
The Absorption Techniques of MIR and NIR Spectroscopy The Anharmonic Oscillator The picture of the harmonic oscillator cannot be retained at larger amplitudes of vibration owing to: • Repulsive forces between the vibrating atoms. • The possibility of dissociation when the vibrating bond is strongly extended. Accordingly, the allowed energy levels for an anharmonic oscillator have to be modified: where χ is the anharmonicity constant. The potential energy curve is represented by an asymmetric Morse function.
Fundamentals and Overtones In the case of the anharmonic oscillator, the vibrational transitions no longer only obey the selection rule n = 1. This type of vibrational transition is called fundamental vibration. Vibrational transitions with n = 2, 3, ... are also possible, and are termed overtones. Called first, second, and so on, overtones.
The Absorption Techniques of MIR and NIR Spectroscopy Cl Cl Cl H H H re a) • (a) Vibration of diatomic molecule of HCl, (b) potential energy of an ideal harmonic oscillator, and (c) an anharmonic oscillator described by the Morse function. • The minimum in the Morse potential is not the minimum in the actual energy of the diatomic molecule. Diatomic molecules vibrate; diatomic molecules rotate. Thus, within the Morse potential are quantitized levels of vibration and rotation. V V n=3 n=3 Coulomb attraction n=2 n=2 b) n=1 n=1 n=0 n=0 r r Nuclear repulsion c) n=6 n=5 n=4
Combination bands • The frequency of a combination is approx. the sum of the frequencies of the individual bands. • Combinations of fundamentals with overtones are possible as well as well as fundamentals involving two or more vibrations. • The vibrations must involve the same functional group and have the same symmetry. Combination bands for water speciation in hydrated Na2O·6SiO2 (NS6) glasses Shigeru Yamashita, Harald Behrens, Burkhard C. Schmidt, Ray Dupree. Water speciation in sodium silicate glasses based on NIR and NMR spectroscopy. Chemical Geology 256 (2008) 231–241.
The Calculation of Overtones and Anharmonicities With the wave number position of the fundamental vibration ν1 or an overtone νn (n = 2, 3, 4, ...) of the anharmonic oscillator can be given by: The intensities of overtone absorption bands depend on the anharmonicity, and it has been shown that vibrations with low anharmonicity constants also have low overtone intensities. X−−H stretching vibrations, for example, have the largest anharmonicity constants and therefore dominate the spectra in the NIR region.
Fermi Resonance, Darling–Dennison Resonance, and the Local Mode Concept Fermi resonance A overtone or combination band that has the same symmetry and nearly the same frecuency as that of a fundamental vibration is called Fermi resonance. Famous example: Fermi resonance is observed in the Raman spectrum of CO2 Fundamental vibrational modes of the CO2 group. v2 (667 cm-1) v1 (1300 cm-1) 2x (667 cm-1) = 1334 cm-1 v3 (2350 cm-1) Kazuo Nakamoto “Infrared and Raman Spectra of Inorganic and Coordination Compounds: Theory and Applications in Inorganic Chemistry (Volume A)” John Wiley, 1997. ISBN 0-471-16394-5 Robert M. Silverstein, Francis X. Webster, David Kiemle “Spectrometric Identification of Organic Compounds”Edition: 7th ed., John Wiley & Sons, 2005. ISBN 0471393622.
Fermi Resonance, Darling–Dennison Resonance, and the Local Mode Concept A resonance that is of importance in the NIR spectra of water has been discussed by Darling and Dennison, but can also occur in other molecules containing symmetrically equivalent X−−H bonds. Thus, of the three normal modes of water — ν2 bending vibration (1595 cm−1), ν3 antisymmetric stretching (3756 cm−1), and ν1 symmetric stretching (3657 cm−1)—the two stretching vibrations absorb at similar wave number positions but belong to different symmetry species and therefore cannot interact directly. However, energy levels of these vibrations associated with specific vibrational quantum numbers n1, n2, and n3 can interact if they belong to identical symmetry species and have similar energies. These interactions then lead to several pairs of NIR absorption bands with appreciable intensities.
Fermi Resonance, Darling–Dennison Resonance, and the Local Mode Concept The main idea of the local mode model is to treat a molecule as if it were made up of a set of equivalent diatomic oscillators, and the reason for the local mode behavior at high energy (>8000 cm−1) may be understood qualitatively as follows. As the stretching vibrations are excited to high energy levels, the anharmonicity term χ.ν0 tends, in certain cases, to overrule the effect of interbond coupling and the vibrations become uncoupled vibrations and occur as “local modes.” The absorption bands in the spectrum can thus be interpreted as if they originated from an anharmonic diatomic molecule. This is the reason why NIR spectra are often said to become simpler at higher energy. Experimentally, it is found that the inversion from normal to local mode character occurs for high energy transitions corresponding to n ≥ 3.
A comparison of the basic instrumentation of RAMAN, MIR, and NIR spectroscopy RAMAN MIR/ATR NIR No sample preparation Sample preparation required (except ATR) No sample preparation Quartz Light-fiber optics ( > 100 m) Chalcogenide or AgCl light-fiber optics (<10 m) Quartz Light-fiber optics ( > 100 m) Large sample thickness (Up to cm) Small sample volume (μL) or sample thickness (μm) Fiber optics
A comparison of the basic instrumentation of RAMAN, MIR, and NIR spectroscopy RAMAN MIR/ATR NIR Type of acquiring spectra AT-line/In-line probes ATR-probes Transmission, transflection, diffuse-reflection probes Instrument Design NIR-Raman (FD) VIS-Raman (CCD) FT-IR Grating, FT-NIR, AOTF, Diode-array, discrete filter
NIR reflectance vs. NIR transmission NIR Refelectance NIR Transmission (NIT) Detector NIR Reflectance NIR Transmission NIR Absorption Detector
Visualize Radiation Interacting with Particles IR Beam Detector Position Tablet R.J. Romañach and M.A. Santos, “Content Uniformity Testing with Near Infrared Spectroscopy”, American Pharmaceutical Review, 2003, 6(2), 62 – 67.
Diffuse Reflectance Reflectance is termed diffuse where the angle of reflected light is independent of the incident angle Spectra Affected by: • Particle size of sample. • Packing density of sample, and pressure on sample. • Refractive index of sample. • Crystalline form of sample. • Absorption coefficients of sample. • Characteristics of the sample’s surface. J.M. Chalmers and G. Dent, “Industrial Analysis with Vibrational Spectroscopy”, Royal Society of Chemistry, 1997, pages 153 -162.
Particle Size and Scattering High scattering Smaller particle sizes More remission, less transmission Low Scattering Absorbing power (absence of scattering) Absorption coefficient (includes effects of voids, surface reflection, distance traveled) Larger particle sizes Less remission, more transmission
References 1. H.W. Siesler, “Basic Principles of Near Infrared Spectroscopy”, In Handbook of Near Infrared Analysis Ed. D.A. Burns and E.W. Ciurczak, 3rd ed., CRC Press, Boca Raton, FLA. 2. Miller CE. 2001. Chemical Principles of Near Infrared Technology. In Williams P, Norris K, editors. Near Infrared Technology in the Agricultural and Food Industries, 2nd ed., Saint Paul: American Association of Cereal Chemists, p 19-37. 3. A.S. Bonanno, J. M. Olinger, and P.R. Griffiths, in Near Infra-Red Spectroscopy, Bridging the Gap Between Data Analysis and NIR Applications, Ellis Horwood, 1992. 4. Dahm DJ, Dahm KD. 2001. The Physics of Near-Infrared Scattering. In Williams P, Norris K, editors. Near Infrared Technology in the Agricultural and Food Industries, 2nd ed., Saint Paul: American Association of Cereal Chemists, p 19-37.
Conclusion Over the past years MIR, NIR, and Raman spectroscopy have been further developed to a point where each technique can be considered a potential candidate for industrial quality-control and process-monitoring applications. However, adding up the specific advantages and disadvantages of the individual techniques, NIR spectroscopy is certainly the most flexible and advanced alternative.