NMR Spectroscopy
NMR Spectroscopy. CHEM 430. Introduction to Spectroscopy. Spectroscopy is the study of the interaction of matter with the electromagnetic (EM) spectrum EM radiation displays the properties of both particles and waves This “ packet ” of wave and particle properties is called a photon

NMR Spectroscopy
E N D
Presentation Transcript
NMR Spectroscopy CHEM 430 – NMR Spectroscopy CHEM 430
Introduction to Spectroscopy Spectroscopy is the study of the interaction of matter with the electromagnetic (EM) spectrum • EM radiation displays the properties of both particles and waves • This “packet” of wave and particle properties is called a photon The term “photon” is implied to mean a small, massless particle that contains a small wave-packet of EM radiation/light • The energy E component of a photon is proportional to the frequency n E = hn The constant of proportionality is Plank’s constant, h CHEM 430 – NMR Spectroscopy
Introduction to Spectroscopy • Because the speed of light (c ) is constant, the frequency (n) (number of cycles of the wave per second) can complete in the same time, must be inversely proportional to how long the oscillation is, or wavelength (l): • Amplitude describes the wave height, or strength of the oscillation • Because the atomic particles in matter also exhibit wave and particle properties (though opposite in how much) EM radiation can interact with matter in two ways: • Collision – particle-to-particle – energy is lost as heat and movement • Coupling – the wave property of the radiation matches the wave property of the particle and “couple” to the next higher quantum mechanical energy level c ___ hc ___ n = DE = hn = l l CHEM 430 – NMR Spectroscopy
Introduction to Spectroscopy • Remember atoms and molecules are quantum mechanical particles • Where a photon is a wave with some particle character, matter is made of particles with some wave character – wave/particle duality • As a result of this, the energy of these particles can only exist at discrete energies – we say these energy levels are quantized • It is easy to understand if we visualize the “wave” property of matter as an oscillating string in a box—only certain “energy levels”can exist as the string is bound at both ends: Energy CHEM 430 – NMR Spectroscopy
The Spectroscopic Process 2. Absorption:Molecule takes on the quantum energy of a photon that matches the energy of a transition and becomes excited excited state 5. Detection: Relaxation as photons are reemitted. Spectrometers differ whether they measure actual emission or absorbance hn 4. Relaxation 3. Excitation Energy rest state rest state 1. Irradiation: Molecule is bombarded with photons of various frequencies over the range desired hn hn hn CHEM 430 – NMR Spectroscopy 5
Types of Spectroscopy g-rays X-rays UV Visible IR Microwave Radio Frequency, n (Hz) ~1017 ~1015 ~1013 ~1010 ~105 Wavelength, l ~0.01 nm 10 nm 1000 nm 0.01 cm 100 m Energy (kcal/mol) > 300 300-30 300-30 ~10-4 ~10-6 6 CHEM 430 – NMR Spectroscopy
NMR Spectroscopy • NMR spectroscopy has emerged as the ultimate spectroscopic method for organic structural analysis • Currently, the development of novel NMR methods is in its “golden age” with some of the 2-D methods entering their maturation period as routine spectroscopic methods • A typical NMR sample consists of 1-10 mg of sample, with which a full analysis of 1H, 13C, DEPT, COSY, HMBC, HSQC and NOESY could be done in a few hours on a high-field instrument • Important spin-offs of NMR spectroscopy include a host of medical and security imaging equipment CHEM 430 – NMR Spectroscopy
Brief History of NMR • First NMR spectrum of H2O, 1946: Bloch, F.; Hansen, W. W.; Packard, M. Phys. Rev. 1946, 70 474-85. CHEM 430 – NMR Spectroscopy
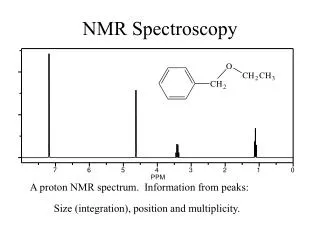
Brief History of NMR • First observation of chemical shift 1H spectrum of ethanol – 1951 vs. 2011 Arnold, J.T., S.S. Dharmatti, and M.E. Packard, J. Chem. Phys., 1951,19, 507. CHEM 430 – NMR Spectroscopy
Brief History of NMR • Fourier transform NMR by Ernst - 1966 CHEM 430 – NMR Spectroscopy
Brief History of NMR • 2D NMR – 1975 Jeener and Ernst CHEM 430 – NMR Spectroscopy
Brief History of NMR (MRI) • First magnetic resonance image – 1973 Lauterbur and Mansfield 2011 CHEM 430 – NMR Spectroscopy
Brief History of NMR • First 3-D spectrum of small protein - 1985Wüthrich CHEM 430 – NMR Spectroscopy
Brief History of NMR Nobel Prizes for NMR • 1944 Physics Rabi (Columbia) • 1952 Physics Bloch (Stanford), Purcell (Harvard) • 1991 Chemistry Ernst (ETH) • 2002 Chemistry Wüthrich (ETH) • 2003 Medicine Lauterbur (University of Illinois in Urbana ) and Mansfield (University of Nottingham) CHEM 430 – NMR Spectroscopy
Basis of NMR Spectroscopy 2.1Magnetic Properties of Nuclei • The sub-atomic particles within atomic nuclei possess a spin quantum number just like electrons • Just as when using Hund’s rules to fill atomic orbitals with electrons, nucleons must each have a unique set of quantum numbers • The spin quantum number of a nucleus is a physical constant, I • For each nucleus, the total number of spin states allowed is given by the equation: 2I + 1 CHEM 430 – NMR Spectroscopy
Basis of NMR Spectroscopy • Observe that for atoms with no net nuclear spin, there are zero allowed spin states • Nuclear Magnetic Resonance can only occur where there are allowed spin states • Note that two nuclei, prevalent in organic compounds have allowed nuclear spin states – 1H and 13C, while two others do not 12C and 16O CHEM 430 – NMR Spectroscopy
Basis of NMR Spectroscopy 2.1Magnetic Properties of Nuclei • There are three types of nuclei: • No spin: I = O • 12C, 16O • Cannot be observed by NMR • Spinning sphere: I = ½ • 1H, 13C, 15N, 19F, 29Si, 31P) • Easiest to observe by NMR • Spinning ellipsoid I = 1, 3/2, 2… • 2H, 11B, 14N, 17O, 33S, 35Cl • Difficult to observe by NMR CHEM 430 – NMR Spectroscopy
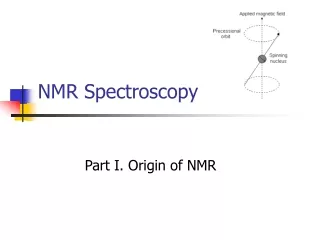
Basis of NMR Spectroscopy 2.1Magnetic Properties of Nuclei • A nucleus contains protons, which each bear a +1 charge • If the nucleus has a net nuclear spin, and an odd number of protons, the rotation of the nucleus will generate a magnetic field along the axis of rotation • A hydrogen atom with its lone proton making up the nucleus, can have two possible spin states—degeneratein energy m H H I = +½ I = -½ m CHEM 430 – NMR Spectroscopy
Basis of NMR Spectroscopy 2.1Magnetic Properties of Nuclei • The magnitude of m varies from atom to atom : m = għI • ħ is Planck’s constant divided by 2p • g is the characteristic gyromagnetic ratio of the nucleus • The larger g is, the greater the magnetic moment CHEM 430 – NMR Spectroscopy
Nuclear Magnetic Resonance CHEM 430 – NMR Spectroscopy
Basis of NMR Spectroscopy 2.1Magnetic Properties of Nuclei • The large external magnetic field is defined as B0 in units of Tesla, T • The axis of B0 is defined as the z-direction • Splitting of spins into quantized groups is called the Zeeman effect DE B0 +z direction CHEM 430 – NMR Spectroscopy
Basis of NMR Spectroscopy 2.1Magnetic Properties of Nuclei • The force of B0 causes m to move in a circular motion about the z-direction – precession • B0 field in z-direction operates on the x component of m to create a force in the y-direction (F = m X B0) • This occurs with an angular frequency w0 known as the Larmor frequency (rad s-1) CHEM 430 – NMR Spectroscopy
Basis of NMR Spectroscopy 2.1Magnetic Properties of Nuclei • A quantum mechanical particle can absorb a photon of energy equal to DE and become promoted to a higher state – spectroscopic process • As B0 increases so does w0 (B0w); the constant of proportionality is g: w0 = g B0 • By equating w0 with Planck’s relationship: DE = hn0= ħw0 = g B0 CHEM 430 – NMR Spectroscopy
Basis of NMR Spectroscopy 2.1Magnetic Properties of Nuclei • What does this mean for the NMR experiment (observing DE)? • Solving for the frequency of EM radiation we are observing: • For a bare hydrogen nucleus (H+), g = 267.53 (106 rad/T·s) • In a B0of 1.41 Tesla: DE = 60 MHz DE corresponds to the highly weak radio region of the EM spectrum: • > 5 meters and energies of < 0.02 cal·mol-1 • This causes technical challenges to observing NMR CHEM 430 – NMR Spectroscopy
Basis of NMR Spectroscopy 2.1Magnetic Properties of Nuclei Boltzmann distribution – more problems with NMR observation • DE at 60 MHz (DE = hn) is 2.39 x 10⁻⁵ kJ mol-1 (tiny) – thermal energy at room temperature (298 oK) is sufficient to populate both energy levels • DE is small, so rapid exchange is occurring between the two populations, but there is always a net excess of protons in the lower energy state • From the Boltzman’s Law we can calculate the population of each energy state: Nupper/Nlower = e-DE/kT = e-hn/kT @ 298 oK the ratio is 1,000,000 / 1,000,009 ! There is an excess population of 9 nuclei in the lower energy state! CHEM 430 – NMR Spectroscopy
Basis of NMR Spectroscopy 2.1Magnetic Properties of Nuclei • As the applied B0 increases, exchange becomes more difficult and the excess increases: • In each case, it is these few nuclei that allow us to observe NMR • When radio radiation is applied to a sample both transitions upward and downward are stimulated – if too much radiation is applied both states completely equilibrate – a state called saturation – no observed NMR signal CHEM 430 – NMR Spectroscopy
Basis of NMR Spectroscopy 2.2Commonly Studied Nuclides CHEM 430 – NMR Spectroscopy
Basis of NMR Spectroscopy 2.2Commonly Studied Nuclides • Remember that the greater DE the easier it is to detect NMR active nuclei and have greater S/N ratios: CHEM 430 – NMR Spectroscopy
Basis of NMR Spectroscopy 2.2Commonly Studied Nuclides • Spin • In general spin ½ nuclei are the easiest to observe • Quadrapolar (I > ½) nuclei are more difficult to observe • Unique mechanism for relaxation gives very short relaxation time • Heisenberg uncertainty principle dictates: DE Dt ~ ħ • As relaxation times become very short, the uncertainty in energies becomes large and peaks broaden greatly CHEM 430 – NMR Spectroscopy
Basis of NMR Spectroscopy 2.1Magnetic Properties of Nuclei • Natural Abundance • Remember from Boltzman’s Law we have only a small excess of nuclei we can observe: 60 MHz, 1.41 T: 1,000,000 / 1,000,009 for 1H • 1H is 99.985% of natural hydrogen - only 9 excess nuclei • Consider the excess population when the nuclei we are observing is 13C – 1.11% of natural carbon • Spin couplings between low-abundant nuclei are also hampered: • Chance of two 1H-1H on adjacent Cs: 99.985 x 99.985 = 99.97% • Chance of two 13C-13C adjacent to one another: 1.11 x 1.11 = 0.1% CHEM 430 – NMR Spectroscopy
Basis of NMR Spectroscopy 2.2Commonly Studied Nuclides • Natural Sensitivity - g • Remember - DE = hn0= ħw0 = g B0 NMR signal a function of only B0 and g • The larger DE the greater the excess population for observation (Boltzmann distribution) • 1H is best followed by 19F in routine observations CHEM 430 – NMR Spectroscopy
Basis of NMR Spectroscopy 2.2Commonly Studied Nuclides • Receptivity • Mathematical product of abundance and g • Good quick measure of amenable a nuclei is for observation • Your text uses 13C as a guidepost rather than 1H • Quick survey: • 1H is 5680 times easier to observe than 13C • 15N is 2.2% as easy to observe as 13C • 19F is 4730 times easier to obersve than 13C; 31P is 2 times easier CHEM 430 – NMR Spectroscopy
Basis of NMR Spectroscopy 2.3The Chemical Shift • Observation of the NMR phenomenon would be of little use if all protons resonated at the same frequency • In organic compounds protons are not bare nuclei, they are surrounded by an s-orbital of containing an e- shared with an e- in a hybridized orbital of another atom to form a covalent bond • In the presence of an external magnetic field, an induced circulation of electrons opposite to that of a proton is observed since the two are of opposite charges • This induced circulation generates a magnetic field in opposition to the applied magnetic field – a local diamagnetic current CHEM 430 – NMR Spectroscopy
Basis of NMR Spectroscopy 2.3The Chemical Shift • Since the magnetic field “felt” by the proton within this electron cloud is lowered, the resonance condition frequency is also lowered • This effect of lowering the energy of transition by a cloud of electrons is called diamagnetic shielding or shielding - represented as s • The opposite effect – if electron density is removed from the vicinity of the proton is called deshielding • The actual field around the nucleus becomes B0(1 – s); substitution in the energy equation gives: CHEM 430 – NMR Spectroscopy 34
Basis of NMR Spectroscopy 2.3The Chemical Shift • Since the magnetic field “felt” by the proton within this electron cloud is lowered, the resonance condition frequency is also lowered • This effect of lowering the energy of transition by a cloud of electrons is called diamagnetic shielding or shielding • The opposite effect – if electron density is removed from the vicinity of the proton is called deshielding DE B0 +z direction CHEM 430 – NMR Spectroscopy 35
Basis of NMR Spectroscopy • In acetic acid, the –CH3 protons are in an e- rich environment relative to the –OH proton. • Shielding of the electrons opposes B0 and therefore DE is lower than that observed for the –OH proton. Here DE is large as the full effect of B0 is felt DE –CH3 DE –OH B0 +z direction CHEM 430 – NMR Spectroscopy
DE B0 CHEM 430 – NMR Spectroscopy
Basis of NMR Spectroscopy • The effect of electrons on a 1.41 T magnetic field is negligible, but measurable • Compare the resonance frequencies for the protons in fluoromethane vs. chloromethane CH3F CH3Cl • The stronger inductive w/d of electrons by fluorine reduces the resonance frequency by 72 Hz (not MHz) compared to an operating frequency of the instrument at 60 MHz @ 1.41 T – barely 1 part per million (ppm) • Using units of 60000072 vs. 60000000 is clunky at best • There needs to be a reference “proton” by which these “chemical shifts” can be related - the best candidate would be a completely deshielded proton (H+) which does not exist in the solution phase CHEM 430 – NMR Spectroscopy
Basis of NMR Spectroscopy • NMR spectroscopists chose the other end of the spectrum- a proton that was more shielded than any other known proton (at the time) – those in tetramethylsilane (TMS) • The 12 chemically identical protons in TMS were used as the standard zero for an NMR spectrum • The resonance frequency of any proton to be studied (since all were less shielded) would be at parts per million of the operating frequency of the instrument greater than this zero • This allowed NMR instruments of varying field (and thus operating frequency) strengths to use the same scale • Here’s how: CHEM 430 – NMR Spectroscopy
Basis of NMR Spectroscopy • In an applied field of 1.41 T, the resonance frequency for a typical proton is 60 MHz, at 2.35 T it is at 100 MHz – a ratio of 5/3 • Thus, for a given proton, the shift in Hz from the TMS standard should be 5/3 greater in the 100 MHz instrument compared to the 60 MHz • Since these are simple ratios, we can simply factor out the effect of field strength by defining d, or chemical shift to be d = (shift from TMS in Hz) (spectrometer frequency in MHz) …or ppm of the instruments operating frequency CHEM 430 – NMR Spectroscopy
Basis of NMR Spectroscopy 300 MHz spectrum 90 Mhz spectrum 300 Hz 90 Hz CHEM 430 – NMR Spectroscopy
Basis of NMR Spectroscopy • In an applied field of 1.41 T, the resonance frequency for a typical proton is 60 MHz, at 2.35 T it is at 100 MHz – a ratio of 5/3 • Thus, for a given proton, the shift in Hz from the TMS standard should be 5/3 greater in the 100 MHz instrument compared to the 60 MHz • Since these are simple ratios, we can simply factor out the effect of field strength by defining d, or chemical shift to be d = (shift from TMS in Hz) (spectrometer frequency in MHz) …or ppm of the instruments operating frequency CHEM 430 – NMR Spectroscopy
Basis of NMR Spectroscopy • A detailed study of chemical shifts is the basis of Chapter 3 0.0 15 10 9 8 7 6 5 4 3 2 1 downfield d (ppm) upfield deshielded shielded higher DE lower DE CHEM 430 – NMR Spectroscopy
Spectrometer Design Basis of NMR Spectroscopy Continuous-Wave (CW) Instrument An NMR spectrometer needs to perform several functions: • Generate a high (>1 Tesla) magnetic field to split the energy levels of the spin states enough to: • Create an excess nuclei population large enough to observe • Make the radio n that correspond to the transition be observable • Ensure that the field is homogeneous (shimming) • Vary either the applied field or the radiofrequency (RF) to observe different nuclei at their various energies of transition • Receive the faint signal of the relaxation of the excited nuclei to their ground state • Process the signal into a usable spectrum vs. a reference CHEM 430 – NMR Spectroscopy
Basis of NMR Spectroscopy Continuous-Wave (CW) Instrument: RF Detector RF (60 MHz) oscillator Permanent Magnet Variable magnetic field – 1.41 T ± few millionths of T CHEM 430 – NMR Spectroscopy
Basis of NMR Spectroscopy How it works (CW NMR): • The sample is placed in a 5 mm solution cell or tube (experimental aspects we will cover shortly) in the center of a large permanent or electromagnet • A RF oscillator coil at 90° to the sample generates a radio signal at the operating frequency of the instrument (60 MHz for a 1.41 T field) • The overall magnetic field is varied by a small electromagnet capping the poles of the larger field magnet • Remember: DE = n = (g/2p) B0, so variations of either magnetic field or frequency will cover the observed spectral width if the other is held constant • As with older dispersive IR instruments, the sweep of magnetic fields is simultaneous with the movement of the chart paper CHEM 430 – NMR Spectroscopy
Basis of NMR Spectroscopy How it works (CW NMR): • As a particular proton population comes into resonance, a second receiver coil at 90° to the transmitter coil will pick up the change in orientation of nuclear spin • This is recorded by the chart as a voltage response, proportional to the size of the proton population that generated the resonance • One artifact of CW instruments is that the relaxation of the protons is slower than the movement (sweep) of the chart paper • This causes the ringing effect – a decreasing oscillation of the signal after the spectrometer has moved past a given resonance • CW instruments operate by bringing each individual population of protons into resonance individually. CHEM 430 – NMR Spectroscopy
Basis of NMR Spectroscopy Limitations- CW NMR: • Since the spectrum is collected once, the sample must possess enough protons to give a suitable excess population that can be observed – need a concentrated sample • Due to the limitations of the relatively low magnetic field (CW instruments top out at 60-90 MHz) the coupling constants for JHH are relatively large compared to the spectral width – so only simple molecules can be observed and their structures elucidated • For nuclei of lower magnetogyric ratios, g, or natural abundance (13C most specifically) the ratio of radio noise to signal is high CHEM 430 – NMR Spectroscopy
Basis of NMR Spectroscopy 2.4 Excitation and Relaxation – FT-NMR • Let’s revisit the NMR experiment we considered earlier • Recall that at even a high applied B0 only a small excess of nuclei are in the lower spin state (+ ½ ) as per the Boltzman distribution Ex: @ 7.04 T an excess of 50 spins per million • It is important to also note that 298 K imparts enough energy to the system such that all spins are interchanging rapidly: CHEM 430 – NMR Spectroscopy
Basis of NMR Spectroscopy 2.4 Excitation and Relaxation – FT-NMR • So when we are discussing an NMR sample we have quadrillions of protons creating a net magnetization M in the z direction (B0) • The xy components are distributed randomly, and we can think of the rest state as M = Mz • M precesses at the Larmor frequency. We are using the rotating frame of reference to make the visualization easier. z z M y y Bo x x CHEM 430 – NMR Spectroscopy