Download
1 / 1
10 likes | 109 Vues
Explore Mariner 9 Ultraviolet Spectrometer data on Mars through GoogleMars visualization tool. View reflectance footprints at various points, compare spectra, and analyze atmospheric influences. Detailed instructions available for using the tool and accessing new data sets.

E N D
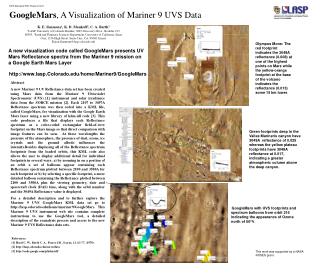
DPS Abstract # 555, Poster 214.07 GoogleMars, A Visualization of Mariner 9 UVS Data K. E. Simmons1, K. D. Mankoff2, C. A. Barth1 1LASP, University of Colorado Boulder, 3665 Discovery Drive, Boulder, CO 80303, 2Earth and Planetary Sciences Department, University of California, Santa Cruz, 1156 High Street, Santa Cruz, CA, 95060. Email: Karen.Simmons@lasp.colorado.edu Olympus Mons: The red footprint indicates the 3049A reflectance (0.008) at one of the highest points on Mars while the yellow-orange footprint at the base of the volcano indicates the reflectance (0.013) some 15 km lower. A new visualization code called GoogleMars presents UV Mars Reflectance spectra from the Mariner 9 mission on a Google Earth Mars Layer http://www.lasp.Colorado.edu/home/Mariner9/GoogleMars Abstract A new Mariner 9 UV Reflectance data set has been created using Mars data from the Mariner 9 Ultraviolet Spectrometer (UVS) [1] instrument and solar irradiance data from the SORCE mission [2]. Each 2107 to 3497A Reflectance spectrum was then coded into a KML file, called GoogleMars, for visualization with the Google Earth Mars layer using a new library of kdm-idl code [3]. This code produces a file that displays each Reflectance spectrum as a color-coded rectangular field-of-view footprint on the Mars image so that direct comparison with image features can be seen. At these wavelengths the pressure of the atmosphere, the presence of dust, ozone, ice crystals and the ground albedo influences the intensity.Besides displaying all of the Reflectance spectrum footprints from the loaded orbits, this KML code also allows the user to display additional detail for individual footprints in several ways: a) by zooming in on a portion of an orbit a set of balloons appear containing each Reflectance spectrum plotted between 2100 and 3500A for each footprint or b) by selecting a specific footprint, a more detailed balloon containing the Reflectance plotted between 2100 and 3500A plus the viewing geometry, date and spacecraft clock (DAS) time, along with the orbit number and the 3049A Reflectance value is displayed. For a detailed description and to further explore the Mariner 9 UVS GoogleMars KML data set go to http://lasp.colorado.edu/home/mariner9/GoogleMars. This Mariner 9 UVS instrument web site contains complete instructions to use the GoogleMars tool, a detailed description of the reanalysis process and access to the new Mariner 9 UVS Reflectance data sets. Green footprints deep in the Valles Marineris canyon have 3049A reflectance of 0.025 whereas the yellow plateau footprints have 3049A reflectance at 0.017, indicating a greater atmospheric column above the deep canyon. GoogleMars with UVS footprints and spectrum balloons from orbit 216 indicating the appearance of Ozone north of 50N. References: [1] Hord C. W., Barth C. A., Pearce J.B., Icarus, 12, 63-77, (1970). [2] http://lasp.colorado.edu/sorce/data [3] http://code.google.com/p/kdm-idl/ This work was supported by a NASA ROSES grant.