
WHAT Object / Deviation
IS - IS NOT / COMPARITIVE ANALYSIS motivates deliberate thinking about the B oundaries of What I s or Is Not. WHAT Object / Deviation. WHEN First seen / Last Reported. HOW BIG How many objects / Defects. WHERE Seen on Product / Process. WHAT section.

WHAT Object / Deviation
E N D
Presentation Transcript
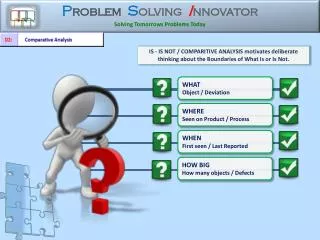
IS - IS NOT / COMPARITIVE ANALYSIS motivates deliberate thinking about the Boundaries of What Is or Is Not. WHATObject / Deviation WHEN First seen / Last Reported HOW BIG How many objects / Defects WHERE Seen on Product / Process
WHAT section D2 – Fill in the data for the ‘WHAT’ section accordingly Help CONSIDER Part Numbers Shop Floor Descriptions Customer Descriptions Help What object has the Defect? Auto Input from Problem Workbook Help What similar object(s) could have the Defect Help What could CAUSE the Difference between the IS Compared to the IS NOT? Other Similar Valves Data to confirm Problem has not previously occurred on similar Parts Help What has changed In / and / around this difference? Major Leak Different Operating Conditions Seal introduced to cope with increased pressure Used only by TooGood Motor Corporation Higher Operating Pressure Help What other Defects “could” have been observed? Help What is the Defect? Auto Input from Problem Workbook Current Help CONSIDER How could the “changes” Have CAUSED the “differences” Help Date change was reversed. If still same ? Enter “current” Help How could these Differences or Changes have Created or Caused the Problem – as it is defined?
WHERE section D2 – Fill in the data for the ‘WHERE’ section accordingly Help CONSIDEREnvironmental factors Contamination Possible Abuse Help Where specifically on the object does the Defect occur? Help Where specifically on the object does the Defect occur? Help What could CAUSE the Difference between the IS compared to the IS NOT? Around Sealing Washer Validate Leakage in Field At other Joints Help What has changed In / and / around this difference? When Vehicle is in the Field On the Pressure Test Vibration of Valve Used in Potentially harsh Operating Conditions Vibration could weaken Torque on Union Loss of Torque on Union Help Where in the Process Flow is the Defect seen Help Where could the Defect have been observed? Help CONSIDER How could the “changes” have CAUSED the “differences” Help How could these Differences or Changes have Created or Caused the Problem – as it is defined?
WHEN section D2 – Fill in the data for the ‘WHEN’ section accordingly Help When in time “could the Defect have been observed? Help CONSIDERMode of Operation Modifications/ Changes Reliability Data Help When since that time has it been seen? Help When in time was the Defect first observed? Help What could CAUSE the Difference between the IS compared to the IS NOT? Validate Service History Before 27-Mar-12 09-Feb-11 Help What has changed In / and / around this difference? During Product/Vehicle Testing Product Cycle Time Lossof Torque 02-April-12 After three months of use Valve was subject to Operating Conditions and Seal possibly “settled in” Vibration could weaken Torque on Union Seal Surface deteriorates Help Consider changes in the Process Cycle. Help When was it Seen But NOT Reported Help Where “should” the Defect have been seen, but wasn’t. Help CONSIDER How could the “changes” have CAUSED the “differences” Help How could these Differences or Changes have Created or Caused the Problem – as it is defined?
HOW BIG section D2 – Fill in the data for the ‘HOW BIG’ section accordingly Help How many Defects per Object, Part or Unit? Help How many units, items, objects, have the defect? Use % or how many out of? Help How often “could” the Defect occur Help How many objects “could” have had the Defect? Help What could CAUSE the Difference between the IS compared to the IS NOT? On 39,992 units Investigate “unreported” instances from routine Servicing 8 from 40,000 units One Multiple Leaks Help How could these Differences or Changes have Created or Caused the Problem – as it is defined? Erratic Operational Use Predictable Help Is the Problem getting Bigger/ Stable / Smaller? Help Could the Problem be worse or better without intervention? Help CONSIDERWarranty Returns Quality Records CP / Cpk Interpretation of extent of Leakage Different Service Outlets Different Service Outlets Help CONSIDER How could the “changes” have CAUSED the “differences” Help What has changed In / and / around this difference?
This completes the D2 Comparative Analysis Now start the Flow Chart