Download
1 / 39
390 likes | 504 Vues
Potential, Structure, and Status of the Global Market for GHG Credits. by Matthew S. Mendis & Robert F. Lee Alternative Energy Development, Inc. 25 January 2000, Riga, Latvia. Outline of Presentation. Introduction to AED Drivers for GHG Credit Markets The Demand Picture for GHG Credits

E N D
Potential, Structure, and Statusof theGlobal Market for GHG Credits by Matthew S. Mendis & Robert F. Lee Alternative Energy Development, Inc. 25 January 2000, Riga, Latvia
Outline of Presentation • Introduction to AED • Drivers for GHG Credit Markets • The Demand Picture for GHG Credits • The Supply Picture for GHG Credits • Status of Current GHG Credit Markets • Risks, Uncertainties and Issues • Conclusions
Introduction to AED • Established in 1991 with the principal mission of promoting the development of alternative (renewable and efficient) energy projects. • Assisted in leveraging over US$1 billion for financing of Alternative Energy Projects by working with the MDBs, GEF and donor agencies. • Experience in over 60 countries. • Most staff have over 20 years experience in GHG mitigation project development.
Drivers for the GHG Credit Markets • Kyoto Protocol (Article 3) will require Annex B countries in the aggregate to reduce GHG emissions by at least 5% below 1990 levels in the period 2008-2012 • QELRCs are defined in Annex B, e.g.; • Latvia = 92% of 1990 level • EU = 92% of 1990 level • USA = 93% of 1990 level • Japan = 94% of 1990 level
Drivers for International GHG Credit Markets • The Protocol provides for three “Flexibility Mechanisms” to allow Annex B countries to meet their reduction commitments. • Article 6: Joint Implementation (JI) • Article 12: Clean Development Mechanism (CDM) • Article 17: Emissions Trading(ET)
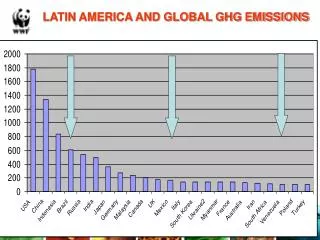
Expected Demand for GHG Credits • Most of the OECD-Annex B countries are unlikely to meet their commitments. • Number of studies estimate that the baseline scenario for these countries will exceed their commitments: • North America by 21% to 30% • Pacific OECD by 19% to 29% • Western Europe by 16% to 27%
Estimated Domestic Marginal Abatement Cost for Deficit Annex B Parties
Demand Factors for GHG Credits • Most OECD-Annex B Parties will exceed their QELRCs in the first budget period. • The projected excess is estimated at • Low of 621 MtC/yr in 2010 • High of 1,300 MtC/yr in 2010 • The marginal cost of domestic abatement will drive the demand for external GHG credits.
Sources of Supply for GHG Credits • Three principal options are recognized in the Kyoto Protocol for the international supply of GHG credits: • Joint Implementation (JI) = ERUs • Clean Development Mechanism (CDM)=CERs • Emissions Trading (ET)=“Emission Credits” • Additionally, domestic actions can result in the domestic supply of GHG credits.
Estimated International Price for GHG Credits • The MAC for GHG credits from ET = $0/tC
Variability of Demand and Supply Data • There is a wide variation in the estimates of demand, supply and price (marginal abatement costs) data for GHG credits. • The variation derives from uncertainties in: • projected growth in GHGs to 2012; • MAC of domestic actions; • the level of domestic actions required; • the rules for the flexibility mechanisms; • MAC for JI and CDM projects. • The uncertainty is spawning a lot of speculation.
What is the Status of GHG Credit Markets • The private sector is starting to engage in a number of speculative transactions: • mainly in North America; • primarily for low cost credits (<$2.5/tCO2); and • without government approval. • Bilateral pilot programs for JI and CDM are being considered. • National programs for domestic action are being defined.
Australia Canada Denmark New Zealand Norway Russia United Kingdom United States Annex B Countries with Emerging National GHG Trading Programs
Denmark GHG Cap and Trade Scheme • Bill 235 - a CO2 cap and trade scheme was adopted for the electricity sector in May 1999. • Allowances are grandfathered for existing power generating companies based on 1994-1998 emissions. • Penalty for non-compliance is ~ $6 per tonne of CO2. • Current caps are for years 2000-2003 2000: 23 Mt CO2 2001: 22 Mt CO2 2002: 21 Mt CO2 2003: 20 Mt CO2 • In 1997, electricity sector emissions were 29 mt CO2.
Rules of the International GHG Credit Markets • There are no established rules at present. • Independent brokers are beginning to emerge and establish themselves • Natsource / Cantor Fitzgerald / Environmental Financial Products / Trexler / Chicago Board of Trade / Sydney Futures Exchange / Etc. • Brokers appear to be in need of more sellers of “good credits” than buyers.
Risks of the GHG Credit Markets • Most transactions have no established baselines. • Many transactions are for existing projects that have already produced credits. • There appears to be no strict adherence to the JI and CDM time frames. • Many projects (especially in the US) do not have Government validation or approval. • Most projects based on AIJ arrangements have baselines, verification procedures and Government sanction.
Volumes in the GHG Credit Markets • Total volume of transactions for 1999 is estimated at +20 MtCO2 by Natsource. • Transactions have ranged from: • low of 18,000 tCO2 (electronic trade between EPCOR and TransAlta) for DSM project. • high of 6 MtCO2 (IGF Insurance, USA and GEMCO, Canada) for land use project. • Largest deal - 14.5 MtCO2 between Bolivian Govt. and AEP/BP-Amoco and Pacific Corp.
Prices in the GHG Credit Markets • Quoted prices for GHG credits range from • low of a few US cents/tCO2 (Bolivian forestry project) • high of US$30/tCO2 in the (GEF/Norway Poland fuel switching project) • There is a minimal correlation of prices to quality and risks at this stage in the market. • Speculation, market entry and portfolio diversification appear to play a stronger role.
Risk Factors Affecting GHG Credit Prices • Assurance of host government to transfer of credits - host government guarantee; • Validation of project and baseline by host government; • Ability to monitor and verify credits; • Project output market risks; • Technology/project operation risks; • Risks associated with the project owner; • Financial soundness of the buyer; and • Political and other risks.
Strategies for Purchasing GHG Credits • Buyer pays low up-front option premium to retain rights to exercise the option for GHG credits at a higher strike price - popular in North America. • Buyer provides loan to be repaid in GHG credits during operating life of project - carbon price is discounted to it present value. • Buyer negotiates a “carbon purchase agreement” and pays for GHG credits on delivery - carbon price is not discounted.
Lessons Learned form SO2 Trading • Prior to the launch of the SO2 cap-and-trade program in the US, compliance costs were estimated at $600 to $1,500/ton. • The first trades were executed at around $300/ton in 1992 • In 1993 the price dropped to $131/ton and in 1996 to $66/ton. • In 1997 the auction price rose to $107/ton. • In all of this, SO2 emissions fell ahead of schedule and were 34% below allowed levels in 1995-96.
Important Observations • A recently released study by ECN of the Netherlands on the “Potential and Costs of CDM Options in the Energy Sector” states: • “The potential for (GHG credits from) Non-Annex I countries at economic costs per tonne up to US$50/ton CO2 amounts to 2.25Gt of CO2 equivalent. Most of this potential is projected to be achievable at quite low costs. Up to 1.6 Gt/yr appears feasible at economic costs of 1990 US$6/ton CO2.
ECN Projected CDM Supply Curve Source: “Potential and Cost of Clean Development Mechanism Options in the Energy Sector”, ECN, Petten, The Netherlands, 1999.
Conclusions • The activities in GHG credit trading are rapidly increasing. • The uncertainties and risks associated with GHG credits presently traded are still very high. • The rules governing GHG credits need to be clearly established. • Verified and high quality GHG credits will improve confidence in the market. • The global potential for low-cost GHG credits is significant.
Australia GHG Trading Initiatives and Proposals • Since 1998 voluntary participation by entities in an early trial on emissions trading. • Australian Greenhouse Office (AGO) is currently facilitating a consultation that includes government agencies, industry organisations, and other stakeholders for the establishment of a national emissions trading system. • An up-stream cap and trade system is also being considered. The initial proposal is for the period 2001 to 2012. The permits would be auctioned.
Canada GHG Trading Initiatives and Proposals • Greenhouse Gas Emission Reduction Trading (GERT) Pilot project - a platform to match buyers and sellers of emission reductions and registration of matched trades. • National Round Table on the Environment and the Economy (NTREE) - examination of the possible designs for a domestic GHG emissions trading programme; a cap and trading programme is also been considered. • Voluntary Credits Trading (VCT) - credit for early action, purchase of credits by governments, and exemption from GHG emissions regulations for participants.
New Zealand GHG Trading Initiatives and Proposals • Domestic Emissions Trading System is being explored for possible implementation before 2008 and for operation during the first commitment period 2008-2012. • A pilot emissions trading system is also being considered for both small and large emitters. An estimated carbon charge price under the trading system is $5-10 per tonne of CO2 or the international price during the commitment period.
Norway GHG Trading Initiatives and Proposals • The Norwegian government appointed a Commission of Experts to consider a domestic greenhouse gas emissions trading system. The Commission’s recommendations are: • All suitable sources should be included. • Quotas should be sold at the international price if there is a well functioning international market. If such a market does not exist, then quotas may be auctioned. • Quotas should be allocated and traded as certificates. • 90 percent of sources may be regulated by emissions quotas including upstream and downstream sources. • Grandfathering for some sources will need to be further reviewed.
Russia GHG Trading Initiatives and Proposals • Trading emission reduction units (ERUs) under joint implementation. Issues under discussion: • Emissions reduction units traded to be managed authorized organizations and inclusion of obligatory reinvestment of the seller's benefits to new or current projects; and • Splitting of ownership of emission reduction credits between the investor and the host country. The use of proceeds of sold credits in other emission reduction projects by the host country.
UK GHG Trading Initiatives and Proposals • Climate Change Levy (CCL) - a tax of 0.6 pence per kWh on electricity and 0.21 pence per kWh on coal and gas applied to industrial customers. CCL may begin in 2001. • Certain industrial sectors that undertake energy efficiency will be allowed a lower rate of levy. The eligible industrial sectors for reduced levy include: Steel, Aluminum, Chemical, Paper, Ceramic, Food and Drink, Glass, Cement, and Foundries. • In response to the CCL, the Confederation of British Industry (CBI) and the Advisory Committee on Business and the Environment (ACBE) plans to launch in April 2001 an industry-wide pilot emissions trading scheme.
UK CBI/ACBE Proposal • Firms which agree to an annual greenhouse gas emissions limit will receive in return permits to match that limit. • Firms with pre-existing Climate Change Levy agreements based on energy efficiency per unit of output (rather than on an absolute level of GHG emissions) would not receive permits, but would be permitted to participate in trading. • Firms investing in projects to reduce GHG emissions would receive credits for those reductions that could be sold in the market. • Permits not needed to meet a firm’s target in a given year could be banked for use in future years. However, the amount of banked permits that could be used during the Kyoto commitment period of 2008-2012 would be restricted.
US GHG Trading Initiatives and Proposals • Senate Bill 547: The bill introduced in March 1999 would allow entities to receive a credit for reducing emissions or sequestering carbon, including JI projects. The credits can be traded and used in the case of any potential future domestic programme. • House Bill 2520: Similar to Senate Bill 547, this bill would grant emissions credits to companies that voluntarily reduce greenhouse gas emissions. • Draft House proposal on cap and trade: a cap on emissions for upstream energy producers to be coupled with a trading scheme for the allowances.