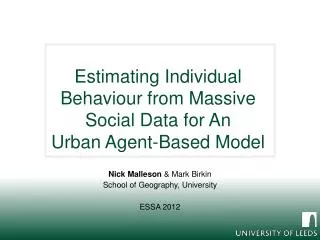
Exploring Metropolitan Dynamics with an Agent-Based Model Calibrated using Social Network Data
180 likes | 280 Vues
This research aims to develop an agent-based model of urban dynamics using novel crowd-sourced data, specifically focusing on Twitter in Leeds to establish behavior from tweets and integrate with the model. Agent-Based Modeling (ABM) represents individuals or groups in a spatial context and models social phenomena from the ground up. The advantages of ABM include its natural fit for social systems, dynamic history representation, and abstract level design flexibility. However, challenges such as computational expense and methodological individualism exist in implementation. Calibrating and validating ABM models require high-quality data, which is difficult to obtain due to sparse sources. Crowd-sourced data sources like Twitter offer potential benefits for calibration and validation in situ. Analyzing individual behavior from geo-located tweets enables insights into spatio-temporal activities and journey patterns, aiding in model calibration with genetic algorithms. Empirical research on crowd-sourced data presents new opportunities for urban dynamics modeling.

Exploring Metropolitan Dynamics with an Agent-Based Model Calibrated using Social Network Data
E N D
Presentation Transcript
Exploring Metropolitan Dynamics with an Agent-Based Model Calibrated using Social Network Data Nick Malleson & Mark Birkin School of Geography, University http://www.geog.leeds.ac.uk/people/n.malleson http://nickmalleson.co.uk/
Outline • Research aim: develop a model of urban-dynamics, calibrated using novel crowd-sourced data. • Background: • Data for evaluating agent-based models • Crowd-sourced data • Data and study area: Twitter in Leeds • Establishing behaviour from tweets • Integrating with a model of urban dynamics
Agent-Based Modelling • Autonomous, interacting agents • Represent individuals or groups • Usually spatial • Model social phenomena from the ground-up • A natural way to describe systems • Ideal for social systems
Advantages of ABM • More “natural” for social systems than statistical approaches • Dynamic history of system • Can include physical space / social processes in models of social systems • Designed at abstract level: easy to change scale • Bridge between verbal theories and mathematical models
Disadvantages of ABM • Single model run reveals a theorem, but no information about robustness • Computationally expensive • Sensitivity analysis and many runs required • Small errors can be replicated in many agents • “Methodological individualism” • Modelling “soft” human factors • Lack of individual-level data for evaluation
Data in Agent-Based Models • Data required at every stage: • Understanding the system • Calibrating the model • Validating the model • But high-quality data are hard to come by • Many sources are too sparse, low spatial/temporal resolution • Censuses focus on attributes rather than behaviour and occur infrequently
Crowd-Sourced Data for Social Science • “Crisis” in “empirical sociology” (Savage and Burrows, 2007) • Traditional surveys are small and occur infrequently • Often focus on population attributes rather than behaviour • Often spatially / demographically aggregated • http://www.guardian.co.uk/p/33p85 • These are being superseded • “knowing capitalism” • Amazon.compurchasing suggestions / supermarket reward cards • “crowd-sourced” data / “volunteered geographical information” • E.g. OpenStreetMap, Flikr, Twitter, FourSquare, Facebook • Potentially very useful for agent-based models • Calibration / validation • Evaluating models in situ
Data and Study Area • Twitter • Social networking / microbloggingservice • Users create public ‘tweets’ of up to 140 characters • For the most part, tweets are publicly available • Include information about user, time/date, location, text etc. • ‘Streaming API’ provides real-time access to tweets • Collected Data • 1.2M+ geo-located tweets around Leeds (June 2011 – March 2012). • 403,922 Tweets within district • 2,683 individual users • Highly Skewed (10% of all tweets from 8 most prolific users) • Filtered non-people
Temporal Trends • Hourly peak in activity at 10pm • Daily peak on Tuesday - Thursday • General increase in activity over time
Spatial Overview • Point density appears to cluster around urban centres. • Also able to distinguish roads in non-urban areas • General pattern somewhat distorted by locations of prolific users
Analysis of Individual Behaviour – Anchor Points • Spatial analysis to identify the home locations of individual users • Some clear spatio-temporal behaviour (e.g. communting, socialising etc.). • Estimate ‘home’ and then calculate distance from home at different times • Journey to work?
Spatio-Temporal Behaviour • More important than aggregate patterns, we can identify the behaviour of individual users • Estimate ‘home’ and then calculate distance at different times • Could estimate journey times, means of travel etc. • Very useful for calibration of an ABM
Activity Matrices (I) • Once the ‘home’ location has been estimated, it is possible to build a profile of each user’s daily activity • The most common behaviour at a given time period takes precedence ‘Raw’ behavioural profiles Interpolating to remove no-data
Activity Matrices (II) • Overall, activity matrices appear reasonably realistic • Peak in away from home at ~2pm • Peak in at home activity at ~10pm. • Next stages: • Develop a more intelligent interpolation algorithm (borrow from GIS?) • Spatio-temporal text mining routines to use textual content to improve behaviour classification
Towards A Model of Urban Dynamics – Design • Use microsimulation to synthesise an initial population (all residents in a city) • Estimate where people go to work • Estimate when people go to work and how long they spend there (initial model parameters) • Calibrate these parameters to data from Twitter (e.g. ‘activity matrices’) using a genetic algorithm
Conclusions & Future Work • New “crowd-sourced” data can help to improve social models • Improved identification of behviour • “Spatio-temporal text mining” • Methods to classify text based on spatio-temporal location as well as textual content • In situ model calibration
Thank you Nick Malleson, School of Geography, University of Leeds http://www.geog.leeds.ac.uk/people/n.malleson http://nickmalleson.co.uk/