Download
1 / 33
360 likes | 553 Vues
Integration of EPC and SPC for effective Process Control by Mani Janakiram, Intel Corporation Doug Montgomery, Bert Keats, Arizona State University. Objective of this presentation : Provide introduction on EPC & SPC as applied to process control

E N D
Integration ofEPC and SPC for effective Process Control by Mani Janakiram, Intel Corporation Doug Montgomery, Bert Keats, Arizona State University • Objective of this presentation: • Provide introduction on EPC & SPC as applied to process control • Show how SPC & EPC can be integrated (simulation + case study) • Discuss types of APC techniques used in the semiconductor industry 2002 ASQ Fall Tech Conference
Introduction • Variability exists in all the processes. Reduction of output variability is critical to process improvement • Process variation may be due to random cause or assignable cause • The objective of process control is to keep the output as close as possible to the target all the time • The output series can be either independent or correlated • Two types of process control techniques exist • Statistical process control (SPC) • Engineering process control (EPC) • Shewhart, EWMA and CUSUM techniques are the common SPC schemes • Integral, PI and PID control schemes with feedback adjustment are the common EPC schemes 2002 ASQ Fall Tech Conference
Monitor Process (take samples, plot and look for assignable causes) Process under control Stop the Process Identify assignable cause(s) Eliminate assignable cause(s) Statistical Process Control (SPC) Statistical Process Control (SPC) aims at achieving process stability and improving process capability by reducing variation. A set of problem solving tools are used in SPC which range from a simple Histogram to sophisticated control charts. SPC is normally applied in the form of open-loop control for process monitoring. Coefficient of variance and/or Process Capability Index (CpK) may be used as SPC indicators. Shewhart X-bar and R charts are commonly used for process monitoring. Yes No SPC suits stationary processes exhibiting no drift/shift in process mean 2002 ASQ Fall Tech Conference
SPC techniques used for process control • For Independent output data • Shewhart control charts (X-bar & R, C, NC, P, etc.) • CUSUM control charts (for small shifts) • EWMA control charts (for small shifts & also for correlated data) • For autocorrelated output data • Time series models (AR, MA, IMA (EWMA), ARMA & ARIMA) • Special cause control charts for residuals • Moving centerline charts • Multivariate control charts (MISO, MIMO) • T2 charts, Multivariate CUSUM & EWMA charts • Principal component analysis (PCA) • Partial least squares techniques (PLS) 2002 ASQ Fall Tech Conference
Monitor Process & Compute next output (Compare with Target) Output equal Target Yes No Compute adjustment (manipulated value) Make adjustment to process input Engineering Process Control (EPC) Engineering Process Control (EPC) also aims at achieving process stability and improving process capability by reducing variation. EPC may be applied in the form of either open-loop or close-loop. The control mechanism could either be feedback or feedforward or combination of both. SPC techniques are often used in combination with EPC. Coefficient of variance and/or Process Capability Index (CpK) may be used as APC indicators. 2002 ASQ Fall Tech Conference
Difference between SPC & EPC Source: Messina, PhD dissertation SPC + EPC = APC 2002 ASQ Fall Tech Conference
Open loop versus Close loop control Close loop control is becoming a necessity for APC. 2002 ASQ Fall Tech Conference
Discrete controllers used in EPC • Proportional control - • Correction is proportional to the error • Xt = Kp * e(t) where Kp is the proportionality controller gain • Integral control - • Correction is proportional to the time integral of the error • Xt = KI * e(u)du where KI is the integral controller gain • Derivative control - • Correction is a measure of rate of change of error • Xt = Kp * (de(t)/dt) where Kp is the derivative controller gain • Combination of the above controls are commonly used: • PI – • PD – • PID - The objective is to minimize mean squared error (MMSE) of the output deviation from target. Minimum mean squared error (MMSE) controllers are set to cancel out the minimum variance forecast made at time t of the disturbance at time t+1. However, when large adjustment is required, constrained controllers are used. Note: Response is shown to a step input 2002 ASQ Fall Tech Conference
Disturbance Manipulated Variable Output Feedback Controller + - + - Process Feedforward Controller Disturbance Manipulated Variable Output + - + - Process Feedforward Controller Disturbance Manipulated Variable Output + - Feedback Controller Feedback Controller + - Process Techniques used to apply compensation Feedback control: Very commonly used. Output is compared to target, Corrective action is computed and applied on manipulated variable in close loop. Ex: CMP uniformity control using R2R feedback control. Feedforward control: Used to eliminate measurable disturbances by adjusting manipulated variable. Can be applied in open loop or close loop. Ex: Alignment check in the lithography. Cascade control: Multiple feedback (and feedforward) loops used to control multistage processes. Works well for processes with intermediate measurable response. Ex: Contact process involving CVD, CMP, Lithography & etch (RIE) sequence. 2002 ASQ Fall Tech Conference
Output Input Measurement (ex-situ) Process Adjustment Adjustment Output Input Measurement (in-situ) Process Adjustment R2R and Real-time control definition R2R control: Set of algorithms to be used for on-line process control with the goal to reduce output variability as measured by the mean squared deviation from target. The R2R controller responds to post-process and summarized in-process measurements by updating process models between runs and providing a new recipe for use in the next run Real-time control: On-line control and instead of minutes or hours before action is taken, the machine is shut down automatically when a computer algorithm discovers that the process is non-normal or out of control. Machine parameters rather than process parameters are measured and monitored. R2R, SPC and Real-time process control fall under Fault detection & Classification (FDC) technique that can be used in open-loop or close-loop mode to ensure that variation is identified and necessary action is applied. 2002 ASQ Fall Tech Conference
Monitor Control System Supervisory Controller Predictive Process Model Monitor Regulatory Controllers Regulatory Control Sensors (End point detection) Relationship among APC components • Key focus areas: • 1. Sensors • 2. Actuators • 3. Control algorithms • 4. Standards • 5. Integration • 6. Automation • 7. Analysis techniques Source: Sematech AEC/APC Conference 2002 ASQ Fall Tech Conference
Pulse Step Ramp Sinusoidal Any combination of the above can also exist Types of Disturbances • Stochastic Disturbances • Exists due to random variation occurring continuously in the process • Disturbance can be either stationary (fixed mean) or non-stationary • They can be modeled using time series models (AR, MA, IMA, ARMA, ARIMA) • Deterministic Disturbances • Exists due to sudden step or ramp changes in load variable at any time • They can be modeled using differential equations & transfer function models like, Pulse, Step, Ramp and Sinusoidal models 2002 ASQ Fall Tech Conference
SPC and EPC techniques for drift/shift scenarios Drift calculation: Yt (I, J) = Yn(I, J)+(I-NSTAT)*sy*(Dt/(N–NSTAT) Shift calculation: Ys (I, J) = Yn(I, J)+sy*Ds Where: Yt (I, J) = Ith drifting observation for Jth simulation run Yn (I, J) = Ith normal random observation for Jth simulation run NSTAT = First observation where the drift or shift is applied N = Total number of observations in a simulation run sy = Standard deviation of the 1st 200 observations Dt = Drift change or delta magnitude Ds = Shift change or delta magnitude • Normal random variates [iid(0,1)] was generated (min. of 1000 simulation runs and 1000 observations per simulation) • A shift or drift in the mean was introduced at the 601st observation • The drift/shift magnitudes investigated were 0.5s to 5.0s with increments of 0.5 • The performance indicators analyzed are: • Output and adjustment variance (SPC/EPC schemes) • Average run length (ARL), standard deviation of run length (SRL) and false alarm (FA) or out of control points (OOC) 2002 ASQ Fall Tech Conference
SPC scheme (EWMA) for 1.5s drift/shift scenario 1.5s drift scenario 1.5s shift scenario • In-control ARL of ~ 370 was used as the baseline • EWMA and CUSUM schemes were sensitive to small drift/shift scenarios • Small l works well for smaller shifts and larger l is suitable for larger shifts • Shewhart scheme is suitable for large drift/shift scenarios • Combined Shewhart-EWMA scheme performs better for both small and large drift/shift scenarios 2002 ASQ Fall Tech Conference
Standard integral and PI schemes • Discrete form of MMSE for integral control scheme: where xt is the adjustment, g is the gain, ej = Yj–T and l is the EWMA parameter, Yt is the output and T is the target • Discrete form of MMSE for PI control scheme: where d is the first order dynamic parameter • These adjustments can be either applied for each observation or can be applied based on SPC limits on the output in the feedback mode 2002 ASQ Fall Tech Conference
SPC/EPC EPC 1.5s shift scenario EPC and SPC/EPC schemes for drift/shift scenario SPC/EPC EPC 1.5s drift scenario 2002 ASQ Fall Tech Conference
Comparison of SPC/EPC scheme with SPC Scheme • Significant improvement in output variance is possible with SPC/EPC schemes • PI control schemes work better for shift scenarios and integral control schemes work better for drift scenarios 2002 ASQ Fall Tech Conference
Comparison of SPC/EPC scheme with EPC Scheme • SPC/EPC schemes result in significant improvement in adjustment variance at the expense of slight increase in output variance • SPC/EPC schemes reduce the frequency and magnitude of adjustment when compared to EPC schemes 2002 ASQ Fall Tech Conference
Constrained integral and PI schemes • Discrete form of constrained integral control scheme: where xt is the adjustment, g is the gain, ej = Yj – T and l is the EWMA parameter, Yt is the output k is a constant and T is the target • Discrete form of constrained PI control scheme: where d is the first order dynamic parameter, K1 and K2 are constants • min(s2x + as2e) would result in optimal constrained controller • These adjustments can be either applied for each observation or can be applied based on SPC limits on the output Source: Box and Luceno 2002 ASQ Fall Tech Conference
Constrained SPC/EPC (PI) schemes for 1.5s drift/shift scenario 1.5s drift scenario 1.5s shift scenario • Reduction of output variability is clearly demonstrated in the figure • No excessive adjustment will be made when constrained SPC/EPC scheme is used • One adjustment is made when the process is under control 2002 ASQ Fall Tech Conference
SPC/EPC EPC 1.5s shift scenario Standard and constrained SPC/EPC (PI) schemes EPC SPC/EPC 1.5s drift scenario 2002 ASQ Fall Tech Conference
Constrained SPC/EPC (PI) scheme for drift scenarios 2002 ASQ Fall Tech Conference
Constrained SPC/EPC (PI) scheme for drift scenarios • The performance indicators analyzed are: • Output and adjustment variance • ARL, SRL, and OOC 2002 ASQ Fall Tech Conference
Comparison of constrained scheme with standard SPC/EPC Scheme Constrained schemes significantly reduce the adjustment variance at the expense of a slight increase in output variance 2002 ASQ Fall Tech Conference
Proposed adjustment scheme to use standard controller as a constrained controller • The manipulated variable is subjected to suitable SPC schemes and adjustments are made • when the manipulated variable is within the control limits and • also the output is outside 2s limits • Adjustment can be either in open-loop or in closed-loop fashion • In open-loop technique, the process is stopped for correction when either output response or manipulated variable goes outside the control limits • In closed-loop technique, the limit applied to the manipulated variable is integrated with adjustment calculation • The performance of the proposed adjustment scheme is comparable and sometimes better than the mathematically complex constrained controllers • It is easy to design and tune this controller for a process exhibiting drift or sustained shift in the process mean 2002 ASQ Fall Tech Conference
Proposed adjustment scheme to use standard controller as a constrained controller (cont.) 1.5s drift/shift scenario 5s drift scenario 2002 ASQ Fall Tech Conference
Application of SPC/EPC techniques to a hybrid industry • Current process is experiencing lot of output variation (powder weight) • Process disturbance is humidity and it corresponds to an EWMA series w/ l = 0.4 • Manipulated variable is amplitude of vibration of the feeder bowl • Integral control is used in SPC/EPC xt = -(2/3) (Yt – 1) • Application of SPC/EPC resulted in significant process improvement • Constrained schemes were applied to avoid excessive adjustment Powder loading process of airbag initiator 2002 ASQ Fall Tech Conference
Shewhart control chart under SPC/EPC Application of SPC/EPC techniques to a hybrid industry Shewhart control chart before SPC/EPC Significant process improvement resulted due to the SPC/EPC scheme 2002 ASQ Fall Tech Conference
Application of SPC/EPC techniques to a hybrid industry • SPC/EPC schemes outperform either the SPC or the EPC schemes • Constrained adjustment scheme significantly reduces the adjustment variability at the cost of a moderate increase in output variance • Performance of the proposed adjustment scheme is comparable to the constrained adjustment scheme 2002 ASQ Fall Tech Conference
Application of SPC/EPC techniques to a hybrid industry Monitoring the powder weight disturbance using control charts (SPC) and adjusting the bowl amplitude based on integral control (EPC) resulted in an effective SPC/EPC integration 2002 ASQ Fall Tech Conference
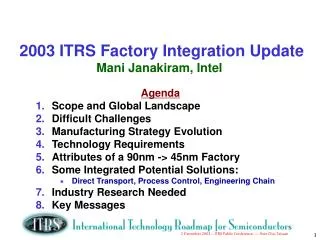
Integrated process control in the semiconductor industry • APC has been identified in the ITRS roadmap as one of key challenges • Integration of the control elements (sensors, actuators, controllers) is critical • Industry consortium is working on integration standards • Benefits of an integrated SPC/EPC to semiconductor industry: • Improved cycle time • Cost savings due to reduced non-product wafers • Reduced operator induced errors • Improved process/product variability 2002 ASQ Fall Tech Conference
Summary • No system left alone would be in a state of perfect statistical control and hence both the drift and shift in the process mean are a reality • Integrated SPC/EPC system is superior to either the SPC or the EPC schemes • Constrained schemes significantly reduce the adjustment variance at the expense of a slight increase in output deviation variance • The proposed simple constrained adjustment scheme is comparable in performance to the complicated constrained adjustment schemes in use today • An integrated SPC/EPC methodology is very relevant to the semiconductor industry • An integrated SPC/EPC process results in improvement in cycle time and throughput, reduction in non-product wafer use, improvement in operator productivity and an overall reduction in process variability • Much more work/research is required in the SPC/EPC area 2002 ASQ Fall Tech Conference
Relevant research work • Following is the list of relevant research work • Box, G. E. P. and Luceno, A (1997). Statistical Control by Monitoring and Feedback Adjustment. John Wiley & Sons, New York, NY • Box, G. E. P. and Luceno, A (1997). “Discrete Proportional-Integral Adjustment and Statistical Process Control”. Journal of Quality Technology 29 (3), pp 248-260 • Janakiram, M. and Keats, J. B. (1998). “Combining SPC and EPC in a Hybrid Industry”. Journal of Quality Technology 30 (3), pp 189-200 • Lu, C. W., and Reynolds, M. R., Jr. (1999a). “EWMA Control Charts for Monitoring the Mean of Autocorrelated Processes”. Journal of Quality Technology 31 (2), pp 166-188 • Lucas, J. M. and Saccucci, M. S. (1990). “Exponentially Weighted Moving Average Control Schemes: Properties and Enhancements”. Technometrics 32, pp 1-12 • MacGregor, J. F. (1990). “A different view of Funnel Experiment”. Journal of Quality Technology 22, pp 255-259 • Montgomery, D. C.; Keats, J. B.; Runger, G. C.; and Messina, W. S. (1994). “Integrating Statistical Process Control and Engineering Process Control”. Journal of Quality Technology 26, pp 79-87 • Montgomery, D. C. (1996). Introduction to Statistical Quality Control, 3rd ed. John Wiley & Sons, New York, NY 2002 ASQ Fall Tech Conference