Download
1 / 12
140 likes | 442 Vues
Learn the theoretical basis of Statistical Process Control (SPC) from Dr. Joan Burtner, a Certified Quality Engineer and Associate Professor. Understand the concepts of process variation, control charts for attributes and variables, and interpreting control charts for effective quality management.

E N D
Theoretical Basis for Statistical Process Control (SPC) Dr. Joan Burtner Certified Quality Engineer Associate Professor of Industrial Engineering and Industrial Management
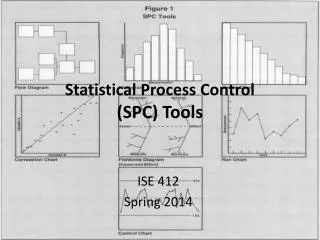
Overview Introduction to SPC Objectives Theory of Process Variation Rational Subgroups Types of Control Charts Construction of Control Charts Control Charts for Attributes Control Charts for Variables Interpretation of Control Charts Manual Application of Tests Statistical Software Application of Tests 2 ISE 468 ETM 568 JMB
Characterizing Causes of Variation The intent of process monitoring is to distinguish between random and non-random variation. 3 ISE 468 ETM 568 JMB
Theory of Process Variation: Statistical Control The common variations in process variability that are caused by natural incidences are in general not repetitive, but various factors due to chance and are called random variation. All processes are subject to random variation. If the cause of variation is systematic (not natural) the process variation is called non-random variation. When non-random variation is present, the quality engineer should identify and eliminate the source of the variation. When a process is subject to non-random variation the process is described as out-of-control. If only random variation is present, the process is described as in-control. 4 ISE 468 ETM 568 JMB
Control Limits, Random and Nonrandom Sample Observations Upper Control Limit (UCL) Non-random Non-random +3σ Process Mean 99.7% Lower Control Limit (LCL) -3σ 1 2 3 4 5 6 7 8 9 10 11 12 Sample number Source: Ozcan Figure 12.4 (Modified for Three Sigma Limits) 5 ISE 468 ETM 568 JMB
Statistical Control Chart Types Attributes Variables(Subgroups) c-chart p-chart u-chart Mean Charts (X-bar Charts) Variation Charts σ Method Range Method 6 ISE 468 ETM 568 JMB
Variables Control Charts (Continuous Data) When process characteristics can be measured, variables control charts are the appropriate way to display the process monitoring. The Xbar-chart and the Range chart are displayed and interpreted together. When the Range chart exhibits out-of-control status, the rules for evaluating the Xbar-chart should not be used. The Xbar chart is appropriately evaluated after the Range chart indicates that the process is in-control. Use caution when statistical software evaluates both charts simultaneously. 7 ISE 468 ETM 568 JMB
Variables Control Charts Variables(Subgroups) Variables (Individuals) Individual observation Moving Range Mean Charts (X-bar Charts) Variation Charts Note that the tests that apply to the subgroup charts do not apply to the Individuals Charts. σ Method Range Method 8 ISE 468 ETM 568 JMB
Attribute Control Charts (Discrete Data) When process characteristics can be counted, attribute-based control charts are the appropriate way to display the process monitoring. The p-chart is the appropriate control chart for a process with only two outcomes (defective or not defective) when the proportion defective is calculated. The c-chart is the appropriate tool to display monitoring if the number of occurrences per sampling period is recorded. The u-chart is the appropriate control chart if the number of occurrences and the number of items per sampling period is recorded. The average number of occurrences per sample is calculated. 9 ISE 468 ETM 568 JMB
Rules for Development of Charts (Devor) • Choose quality characteristic to be measured or counted • Collect at least 25 samples • Develop trial control limits • Evaluate for special causes • Determine special causes and remediate • Eliminate out-of-control points • Recalculate control limits • Continue until chart shows process is in control • Monitor process using established control limits 10 ISE 468 ETM 568 JMB
Interpretation of Control Charts • Look for special cause variation. • Points that are outside 3 sigma limits • Series of points that are unusually close to 3 sigma limits • Non-random patterns such as linear trends, oscillation, runs above or below centerline, to many successive points near the centerline • Textbook tests for special causes differ slightly from Minitab tests but Minitab allows you to adapt the tests. 11 ISE 468 ETM 568 JMB
References Devor, R., Chang, T. & Sutherland, J. (2007). Statistical Quality Design and Control, 2nd ed, Upper Saddle River, NJ: Prentice-Hall. ISBN 0-13-041344-5 Ozcan, Y. (2009). Quantitative Methods in Health Care Management 2nd ed, San Francisco, CA: Jossey-Bass. ISBN-13 978-0-470-43462-8 12 ISE 468 ETM 568 JMB